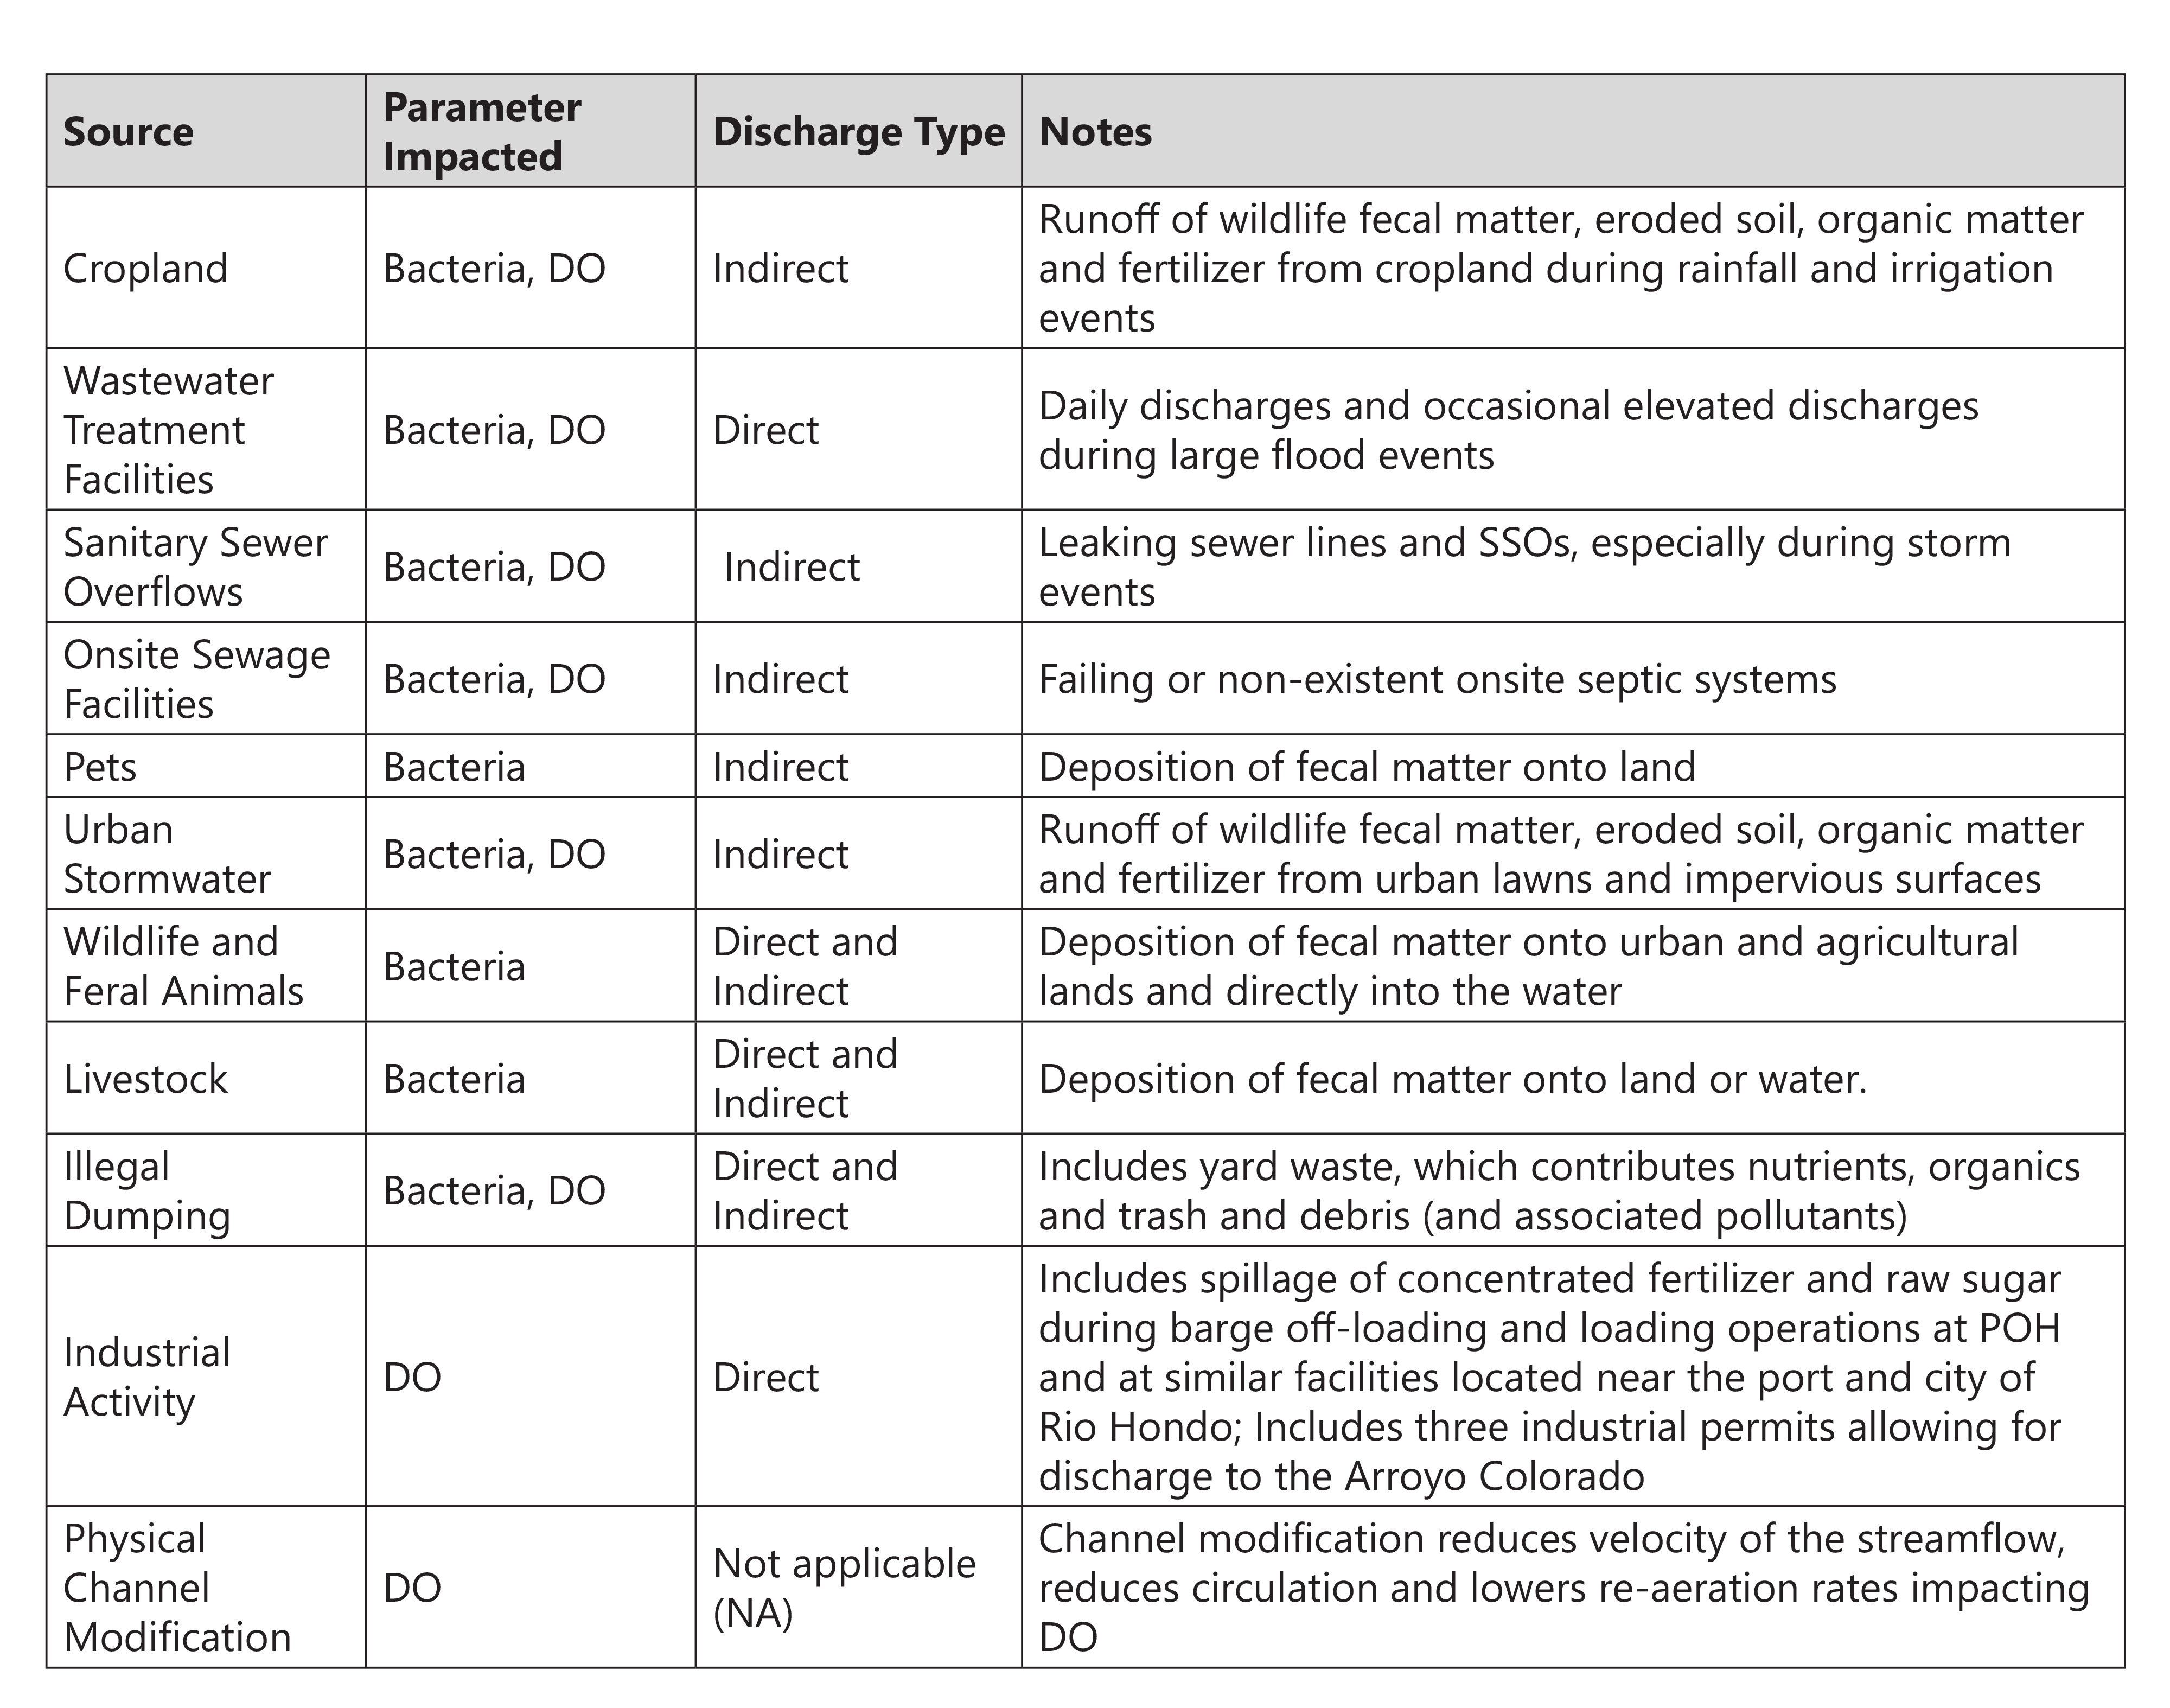
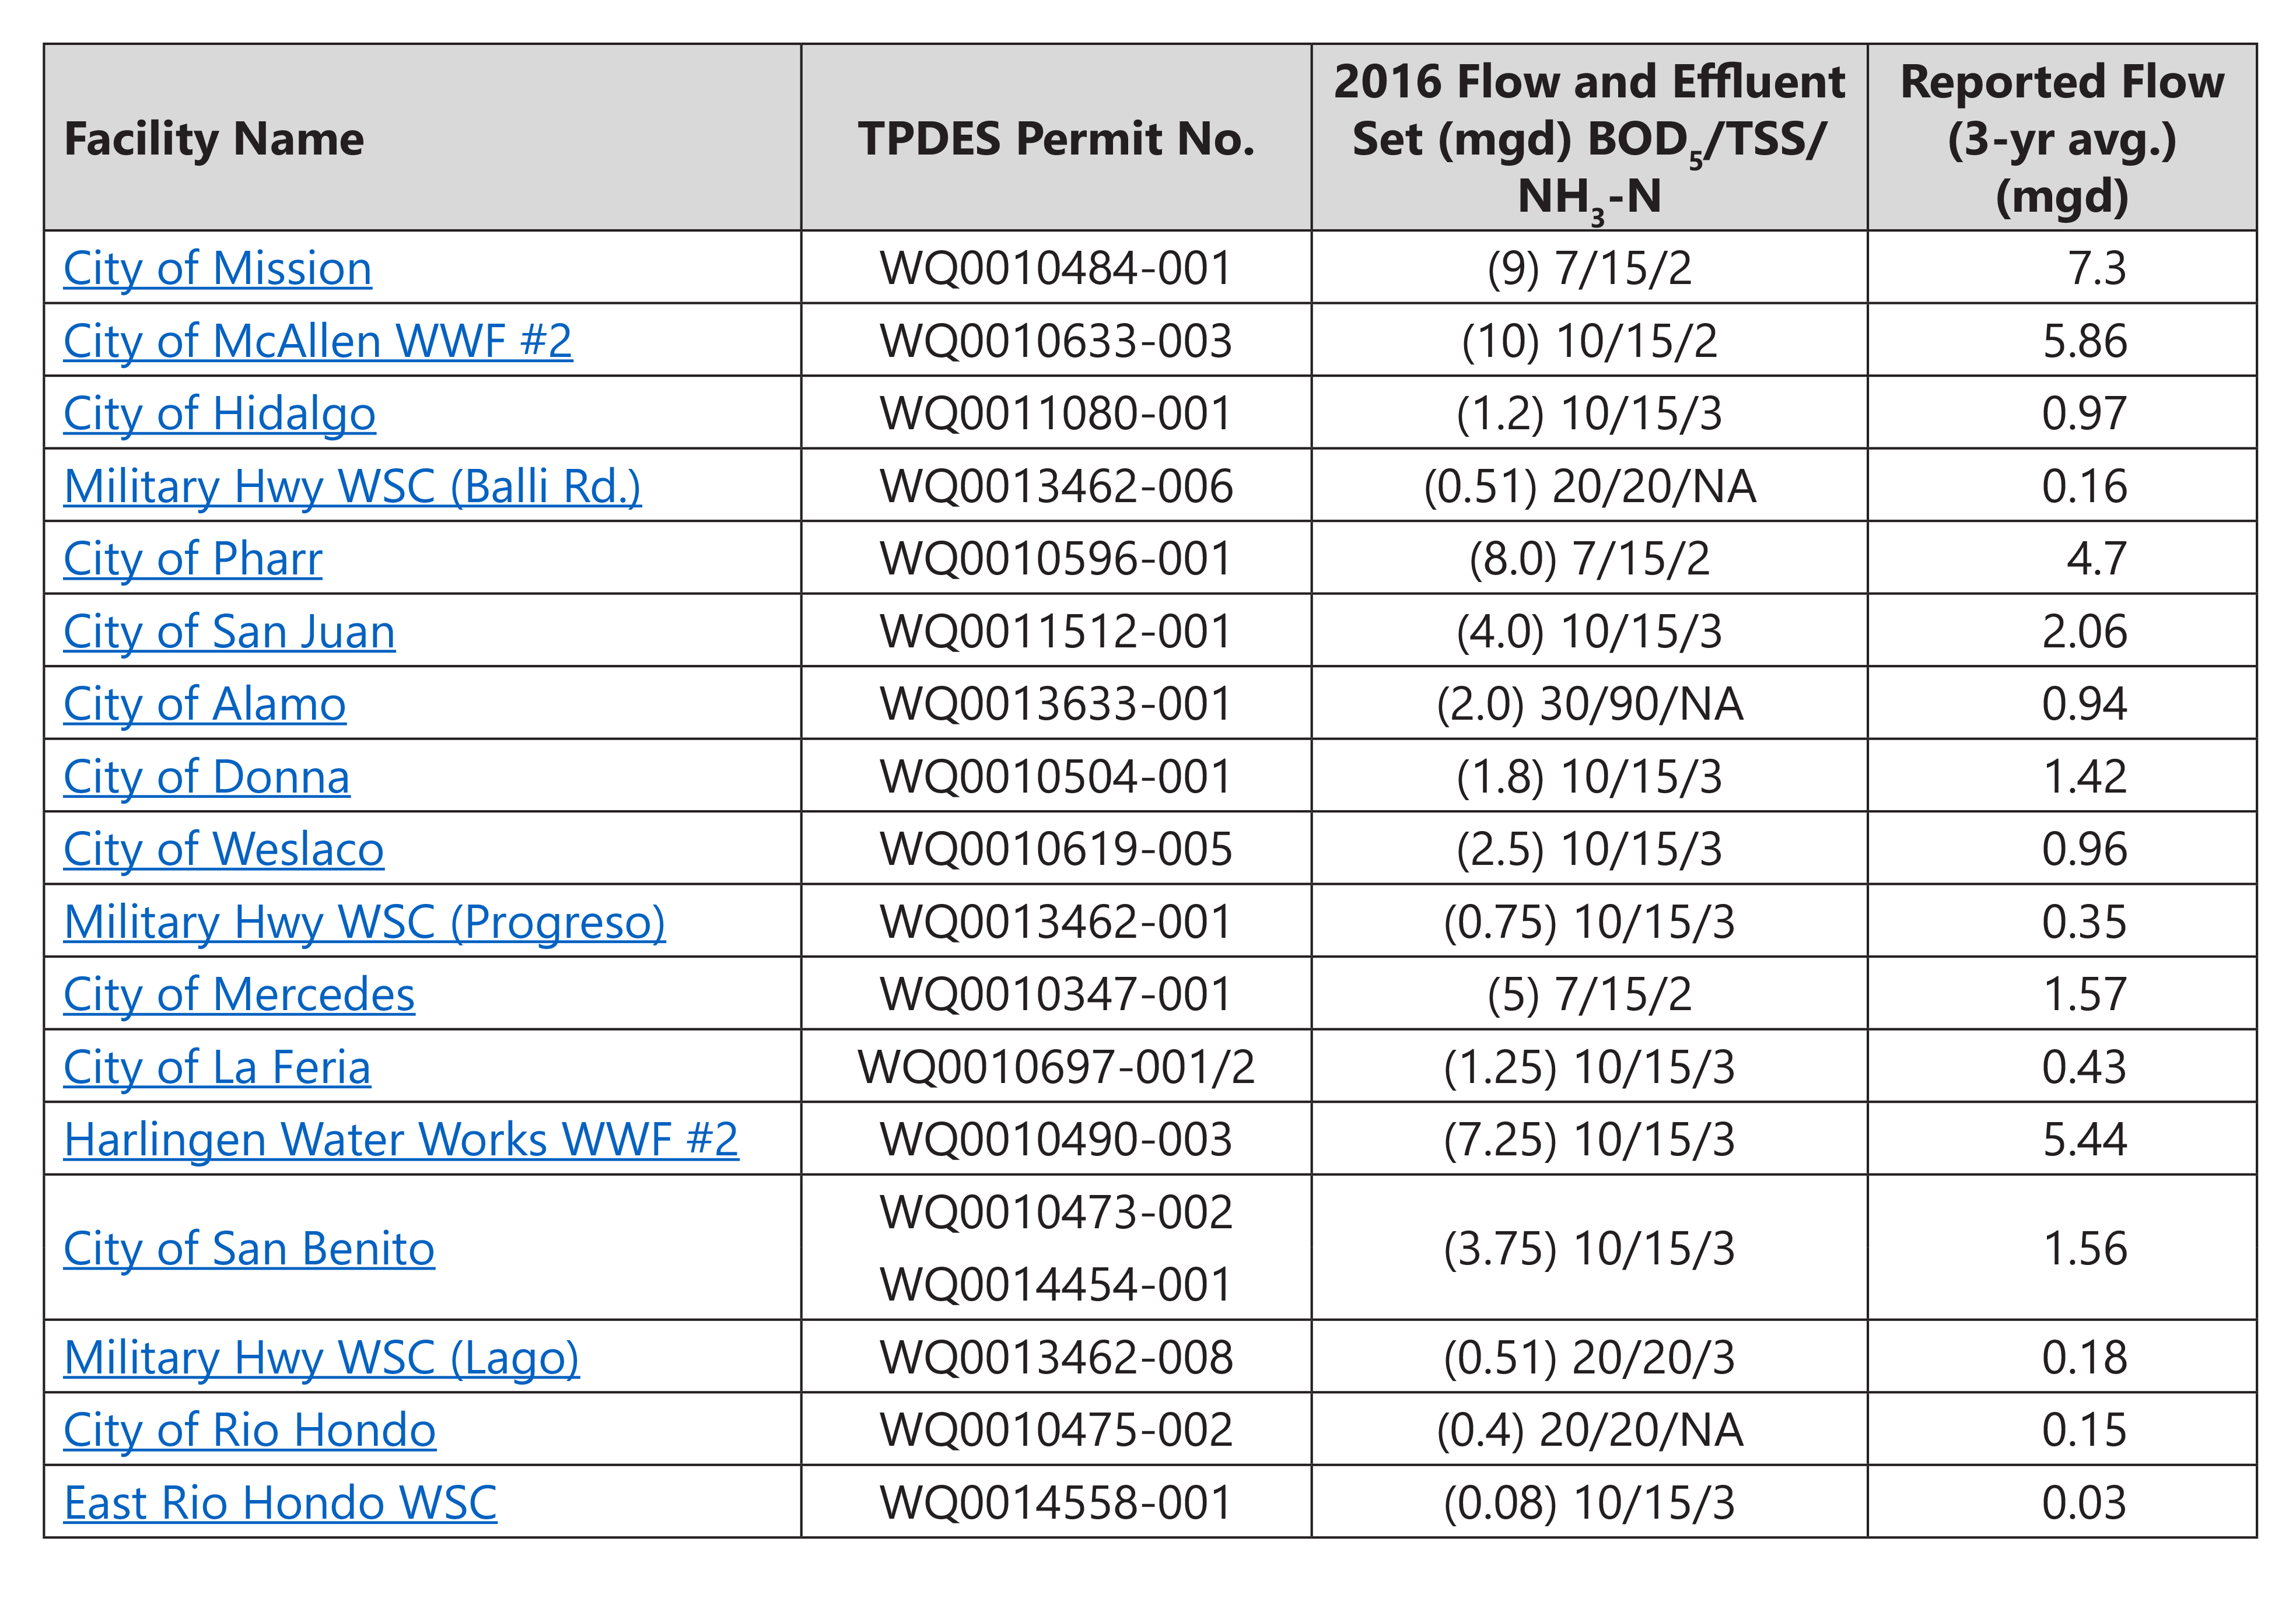
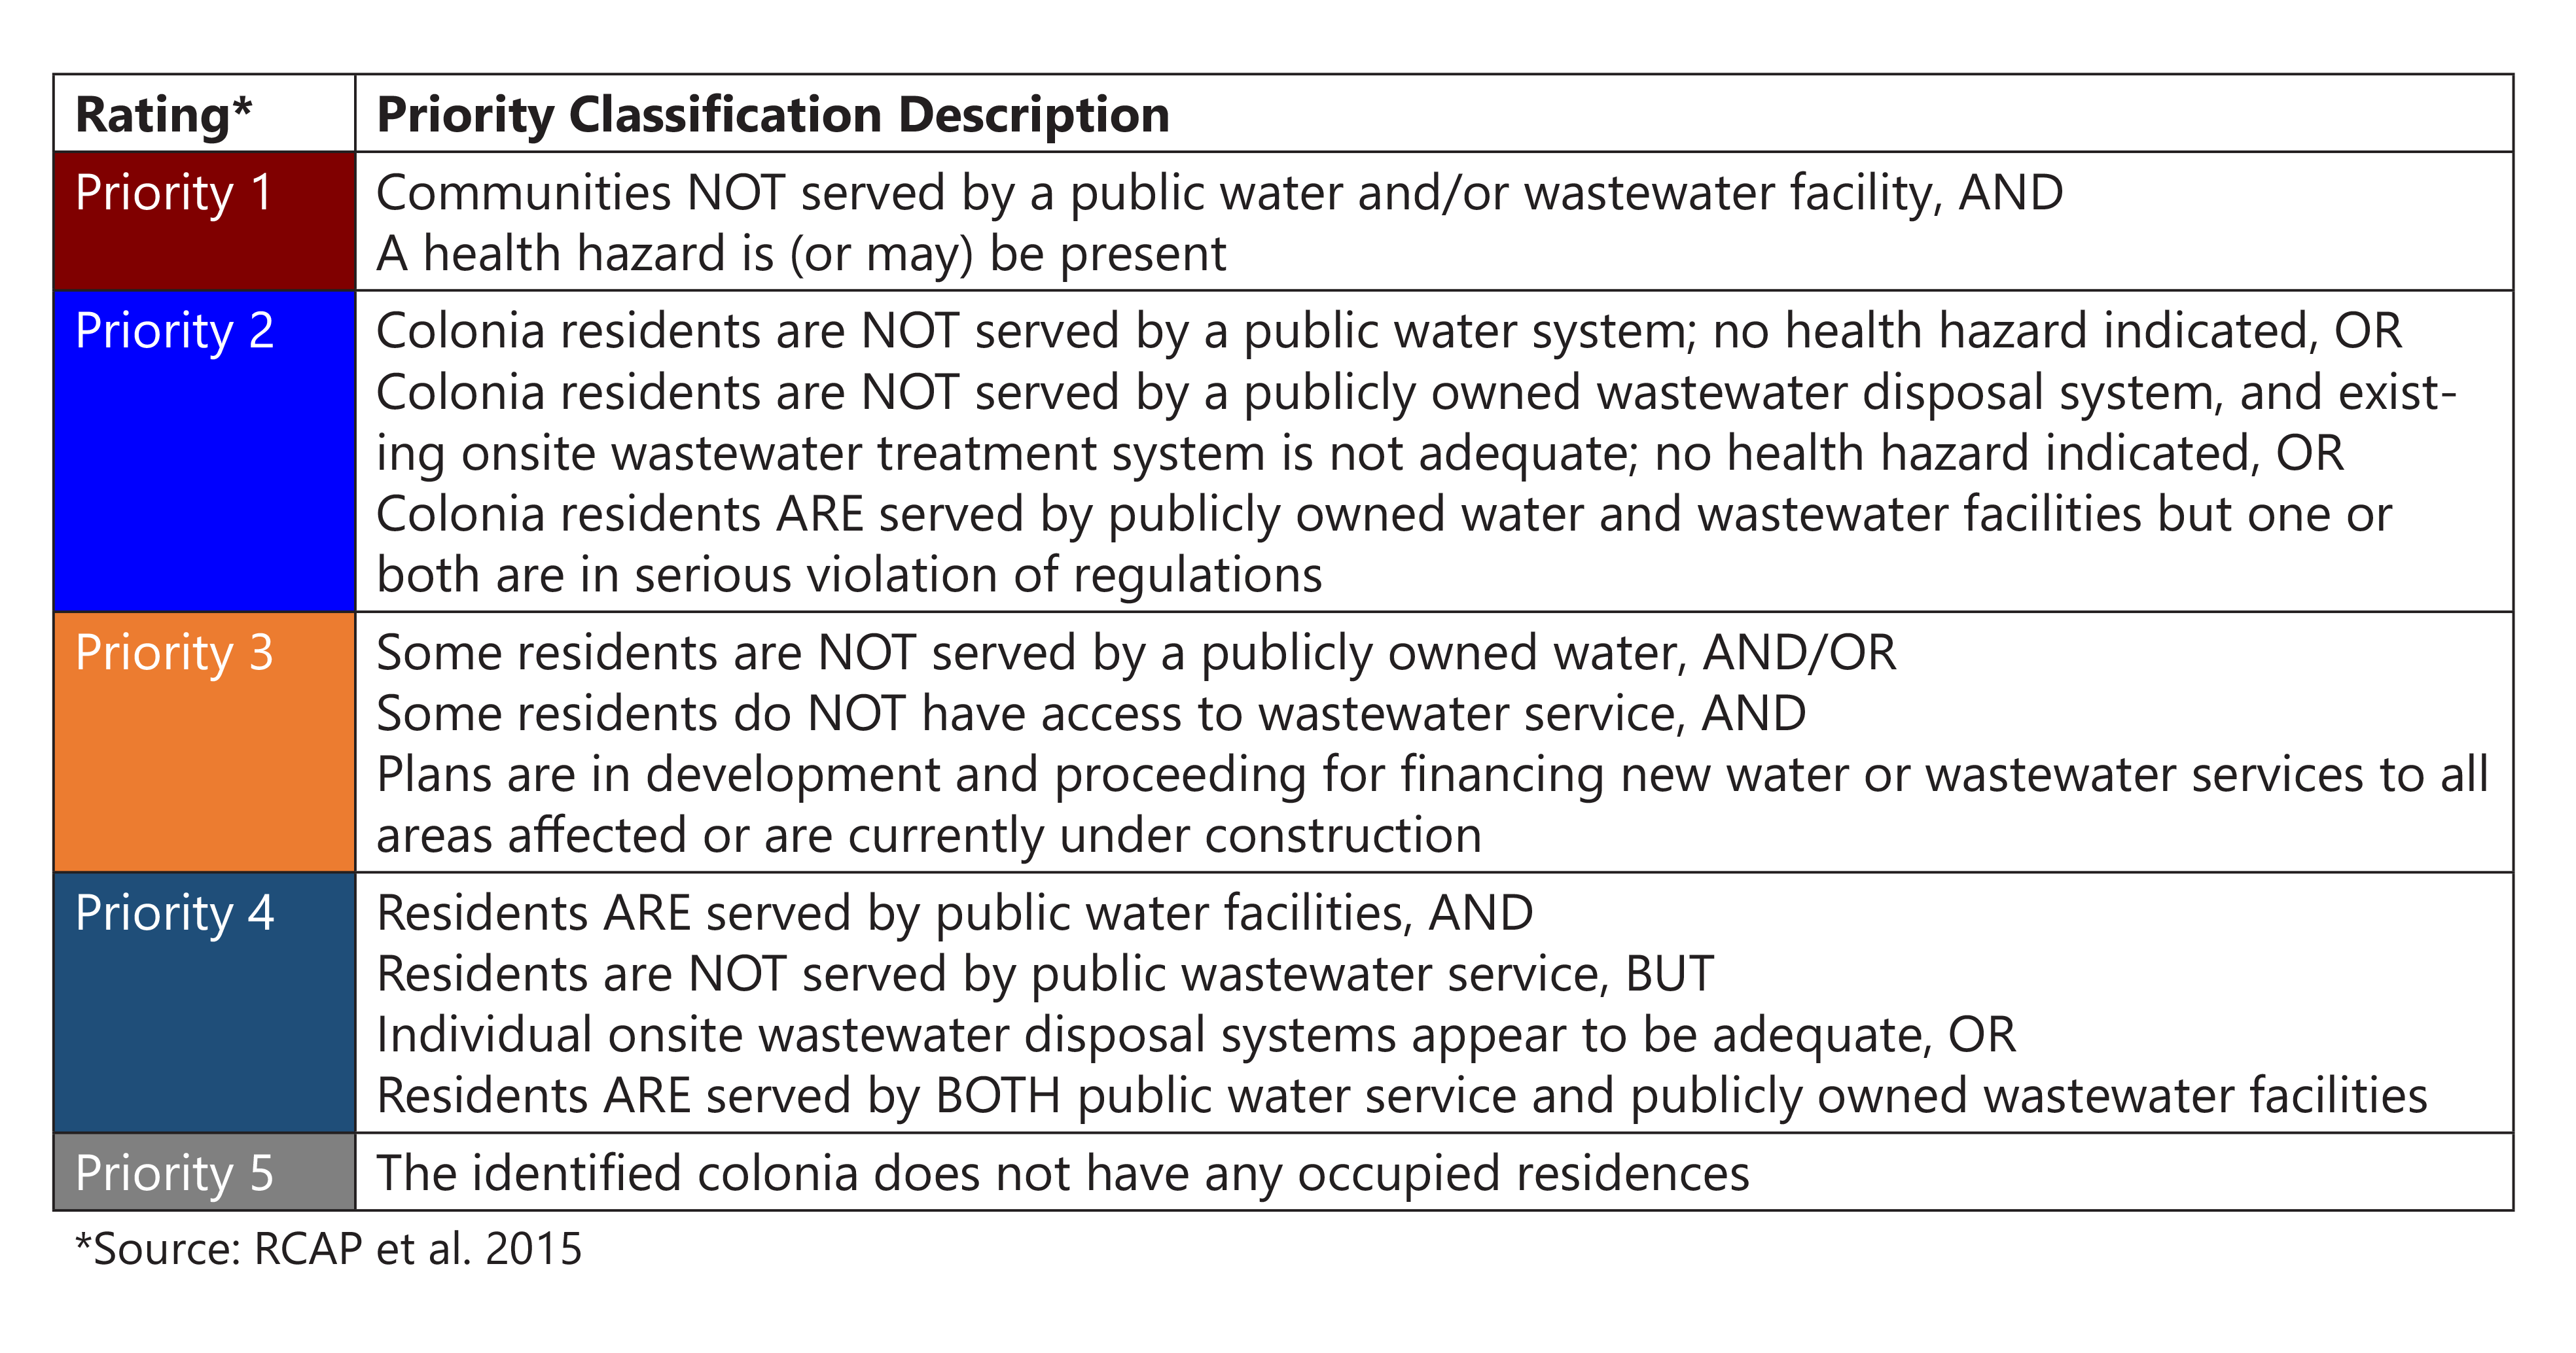
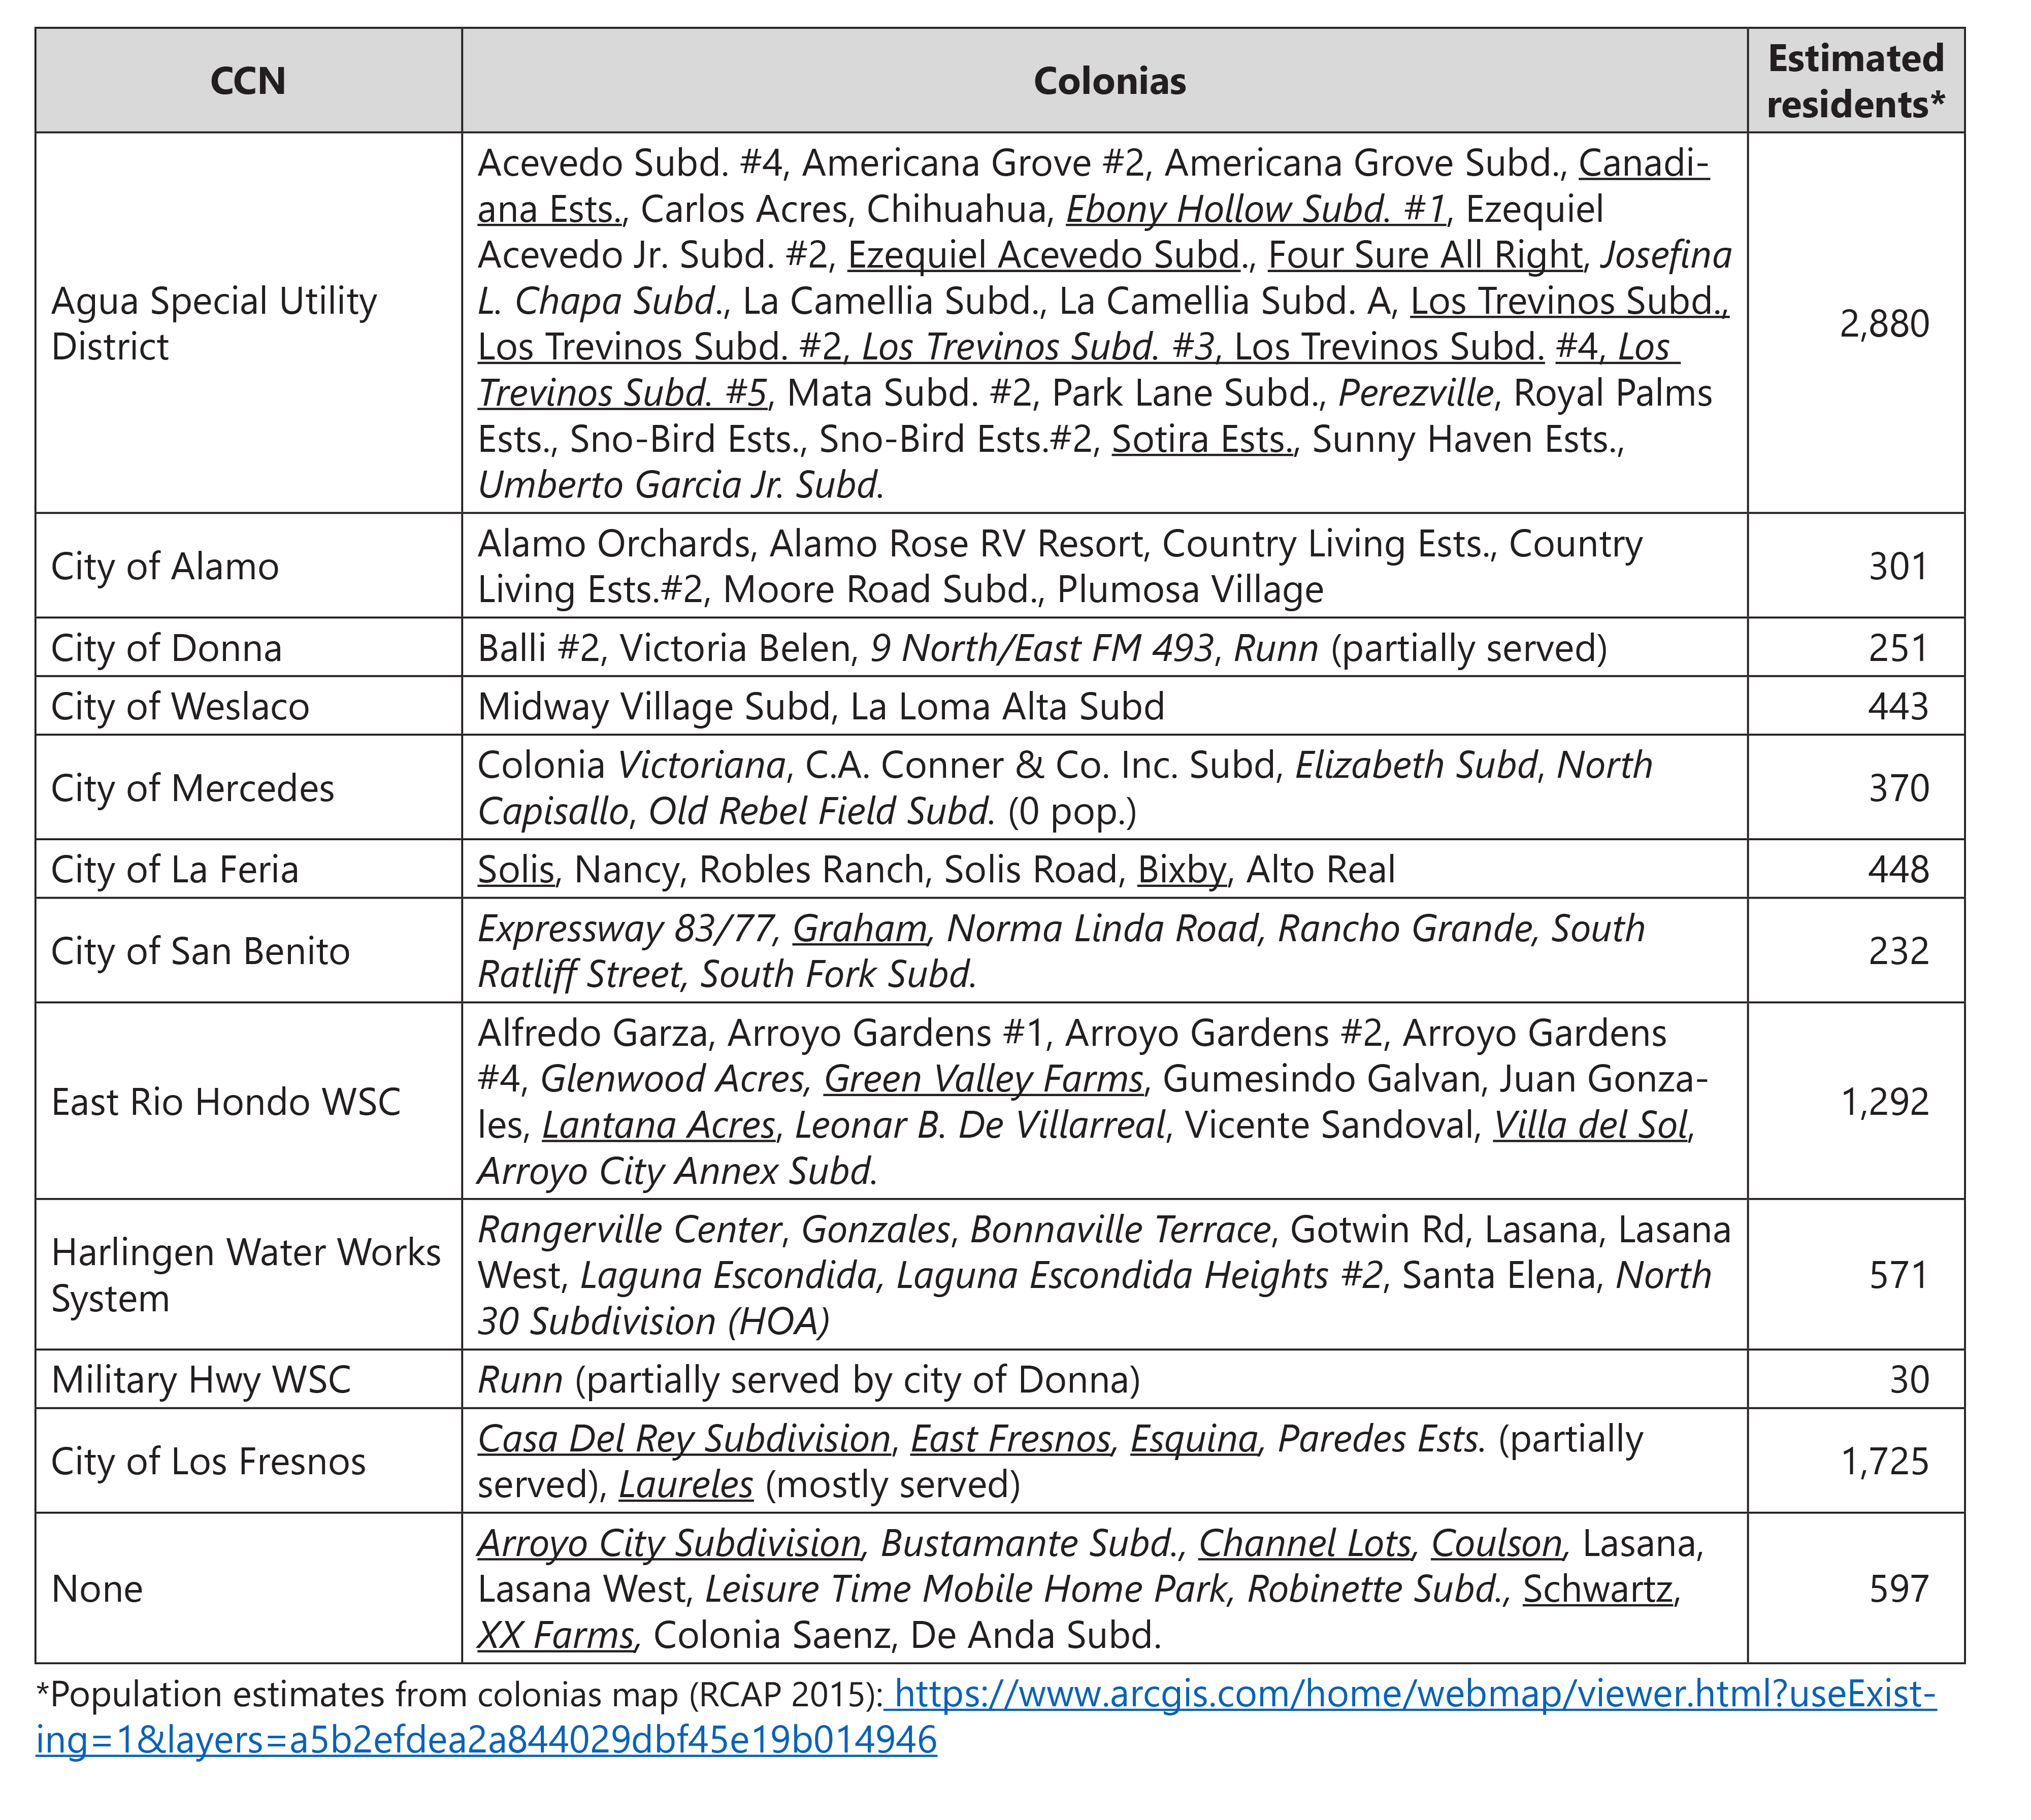
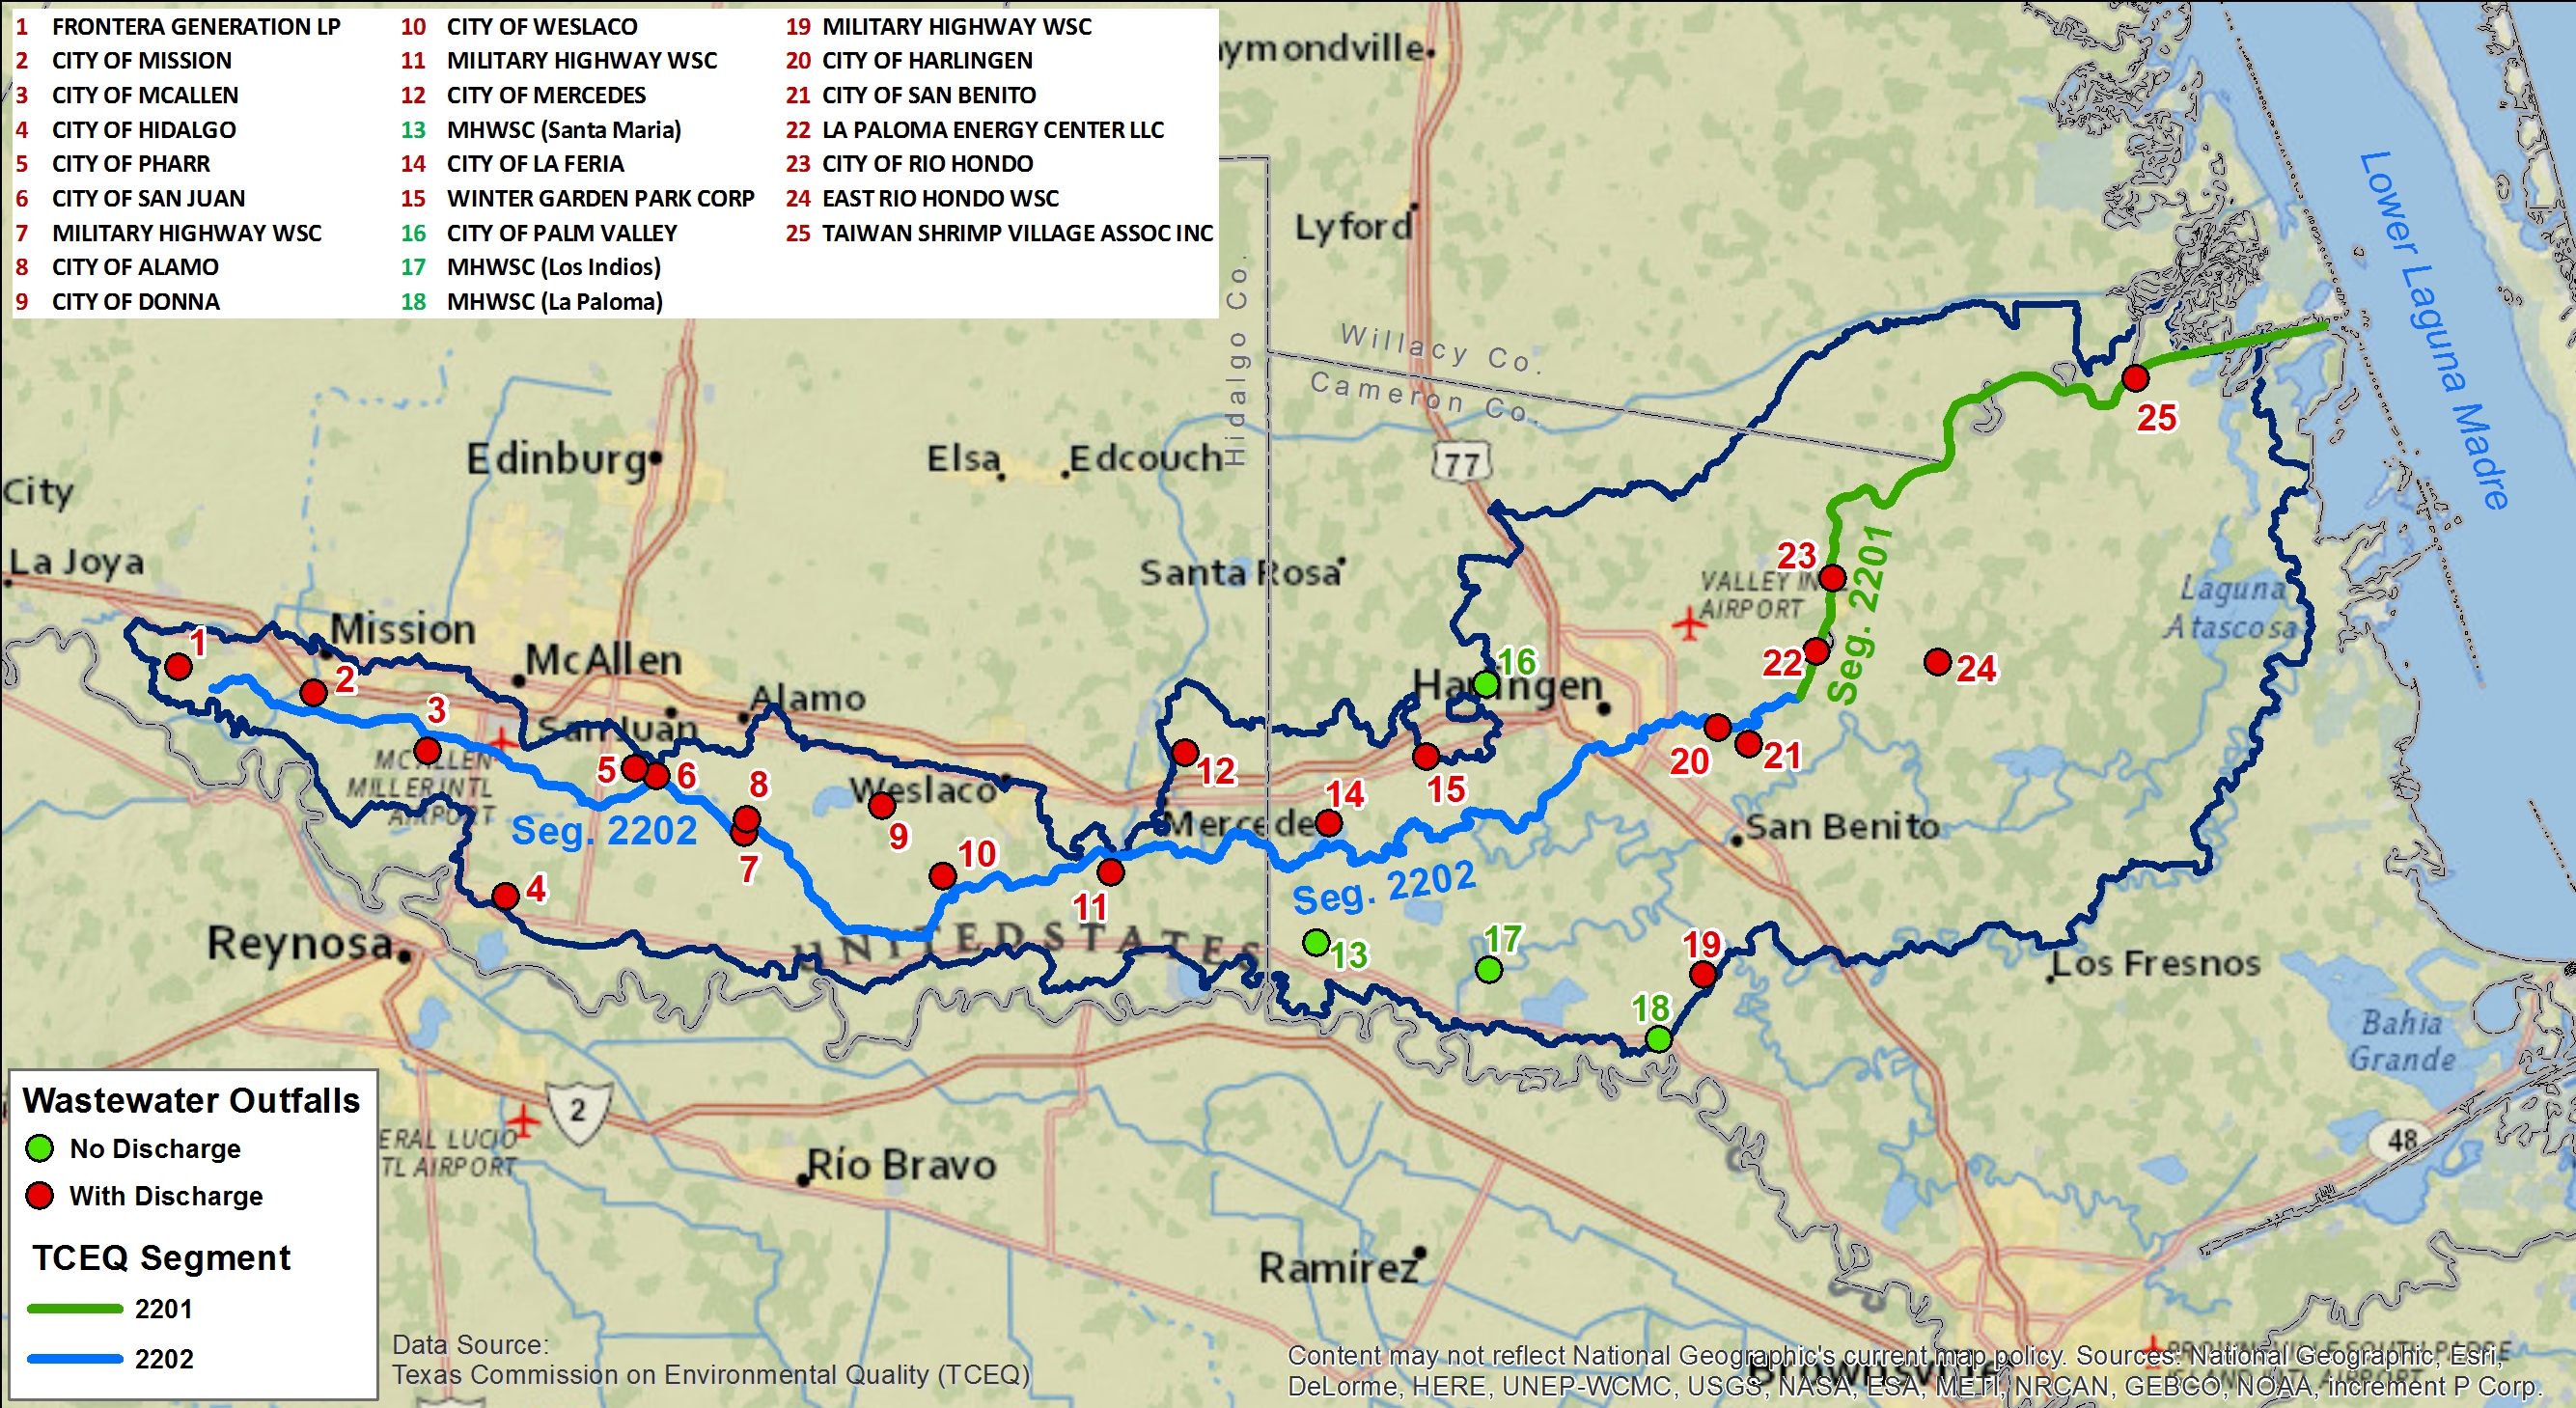
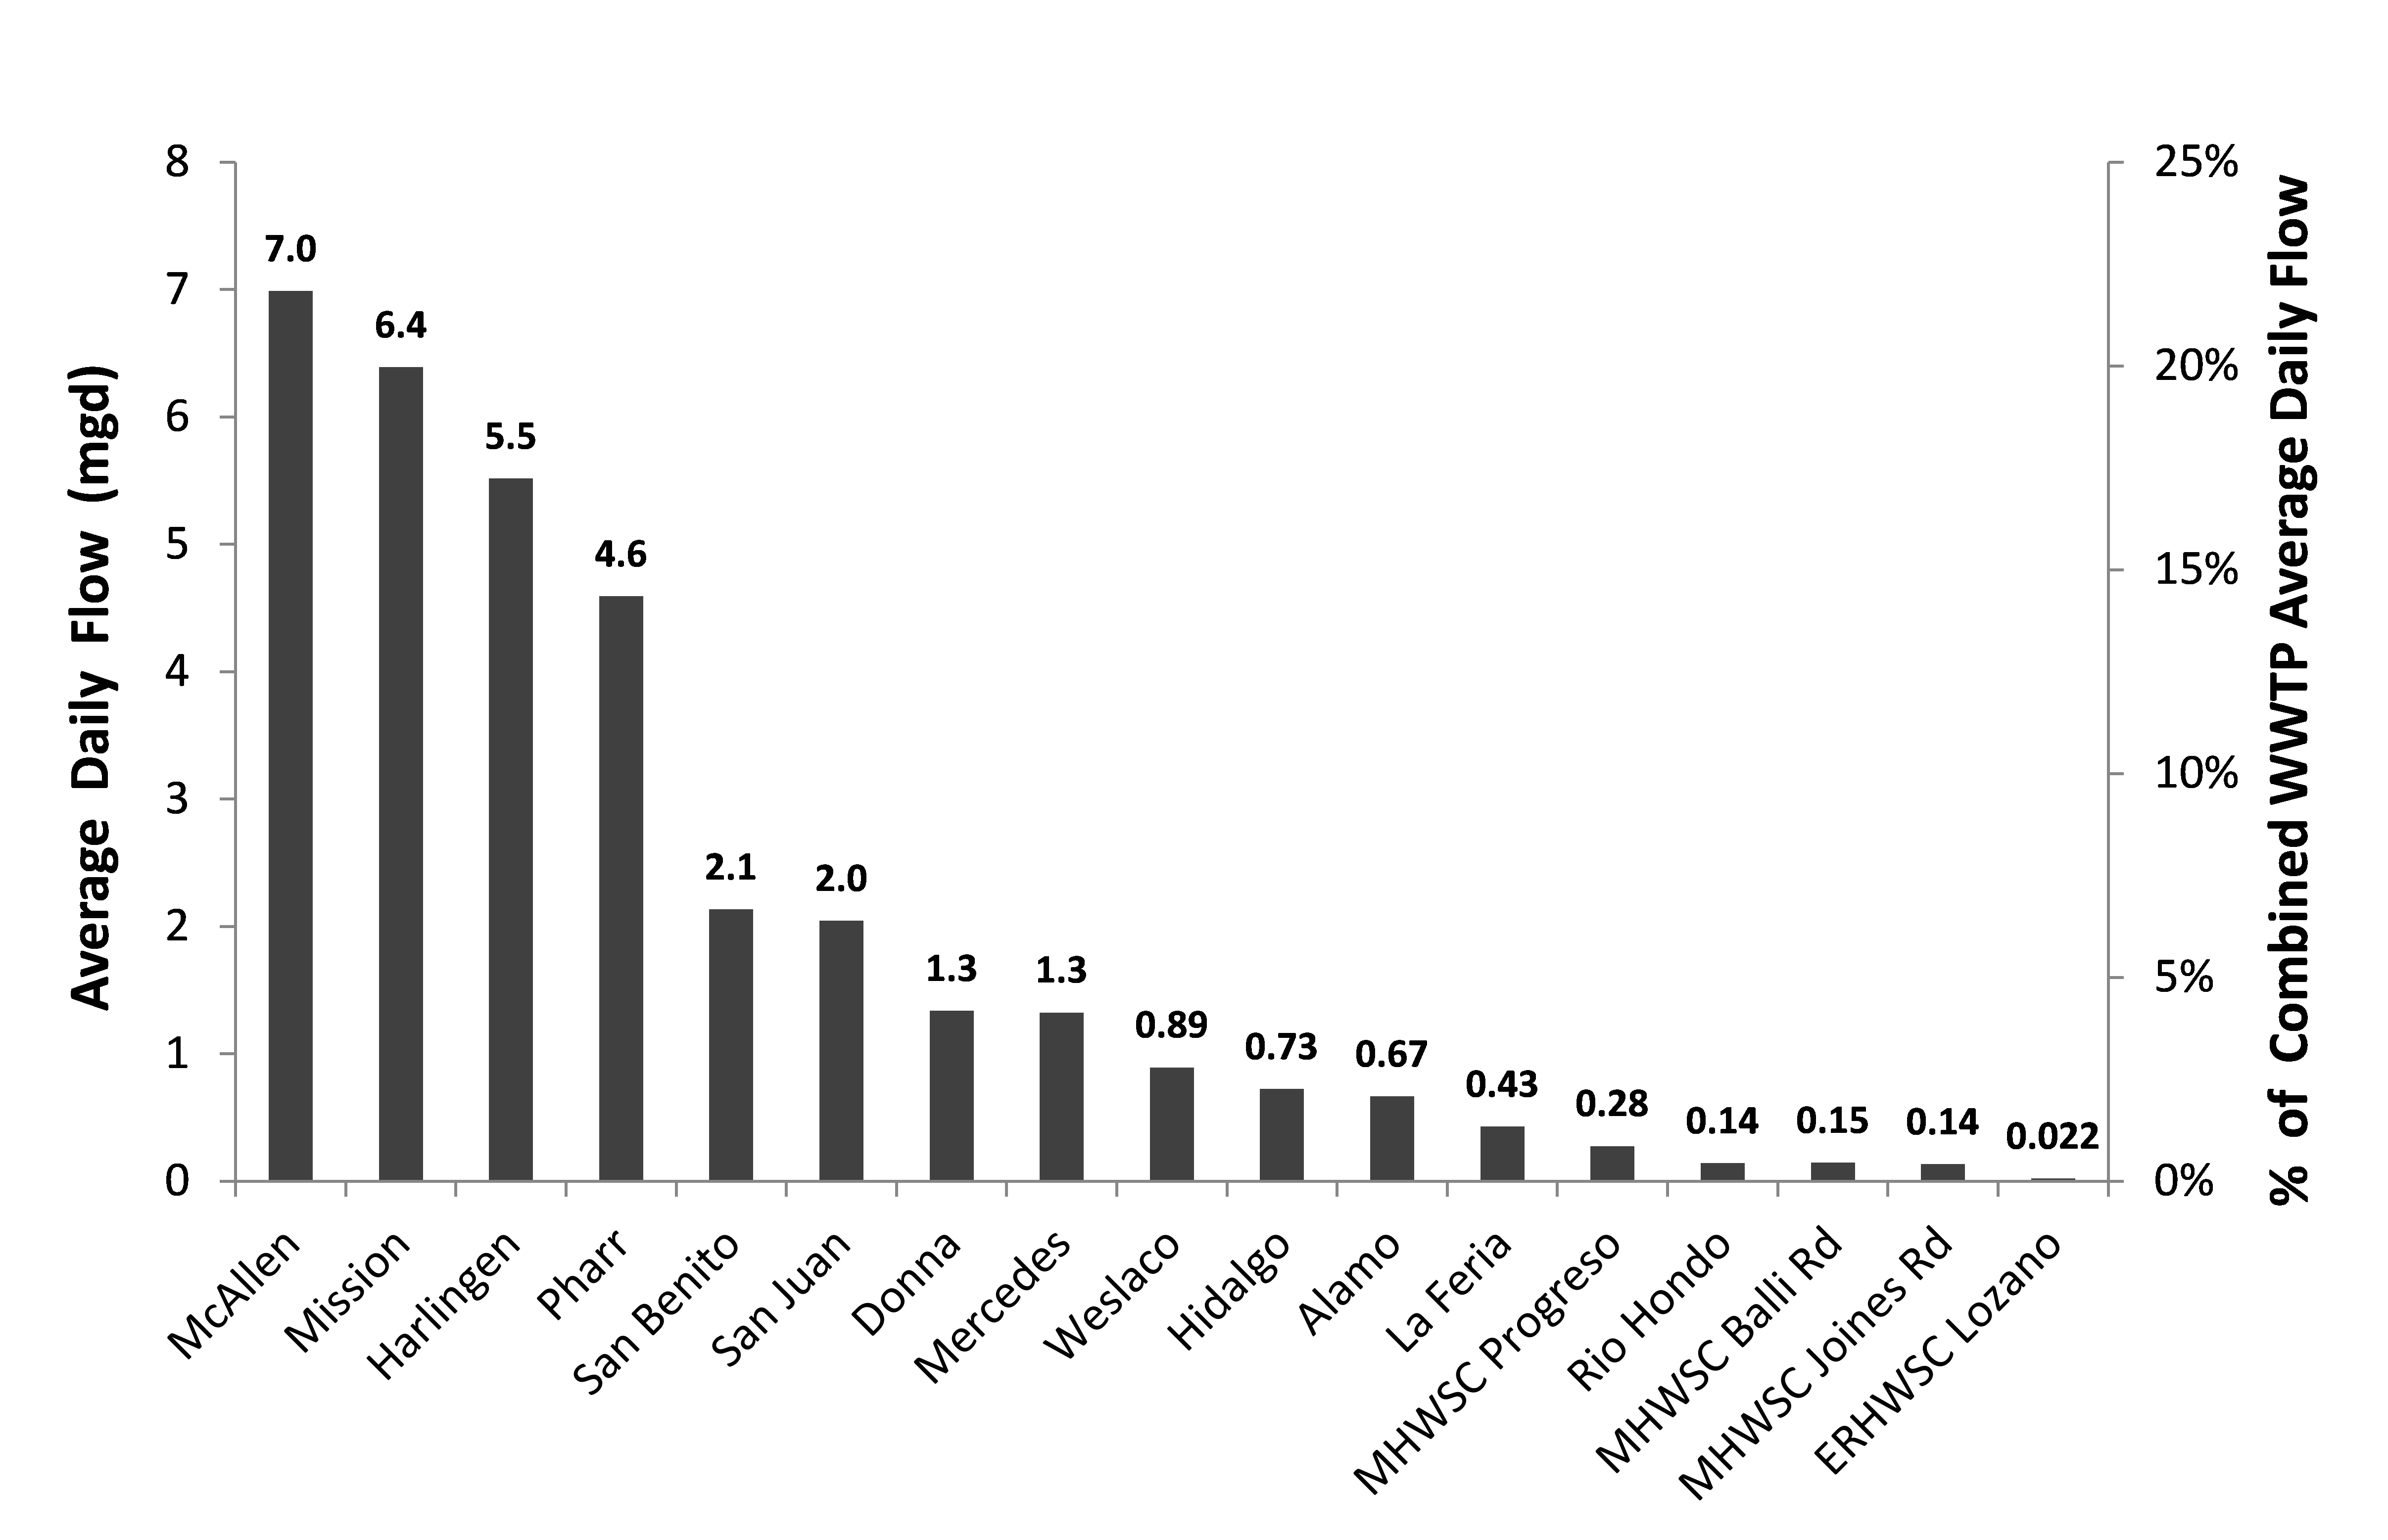
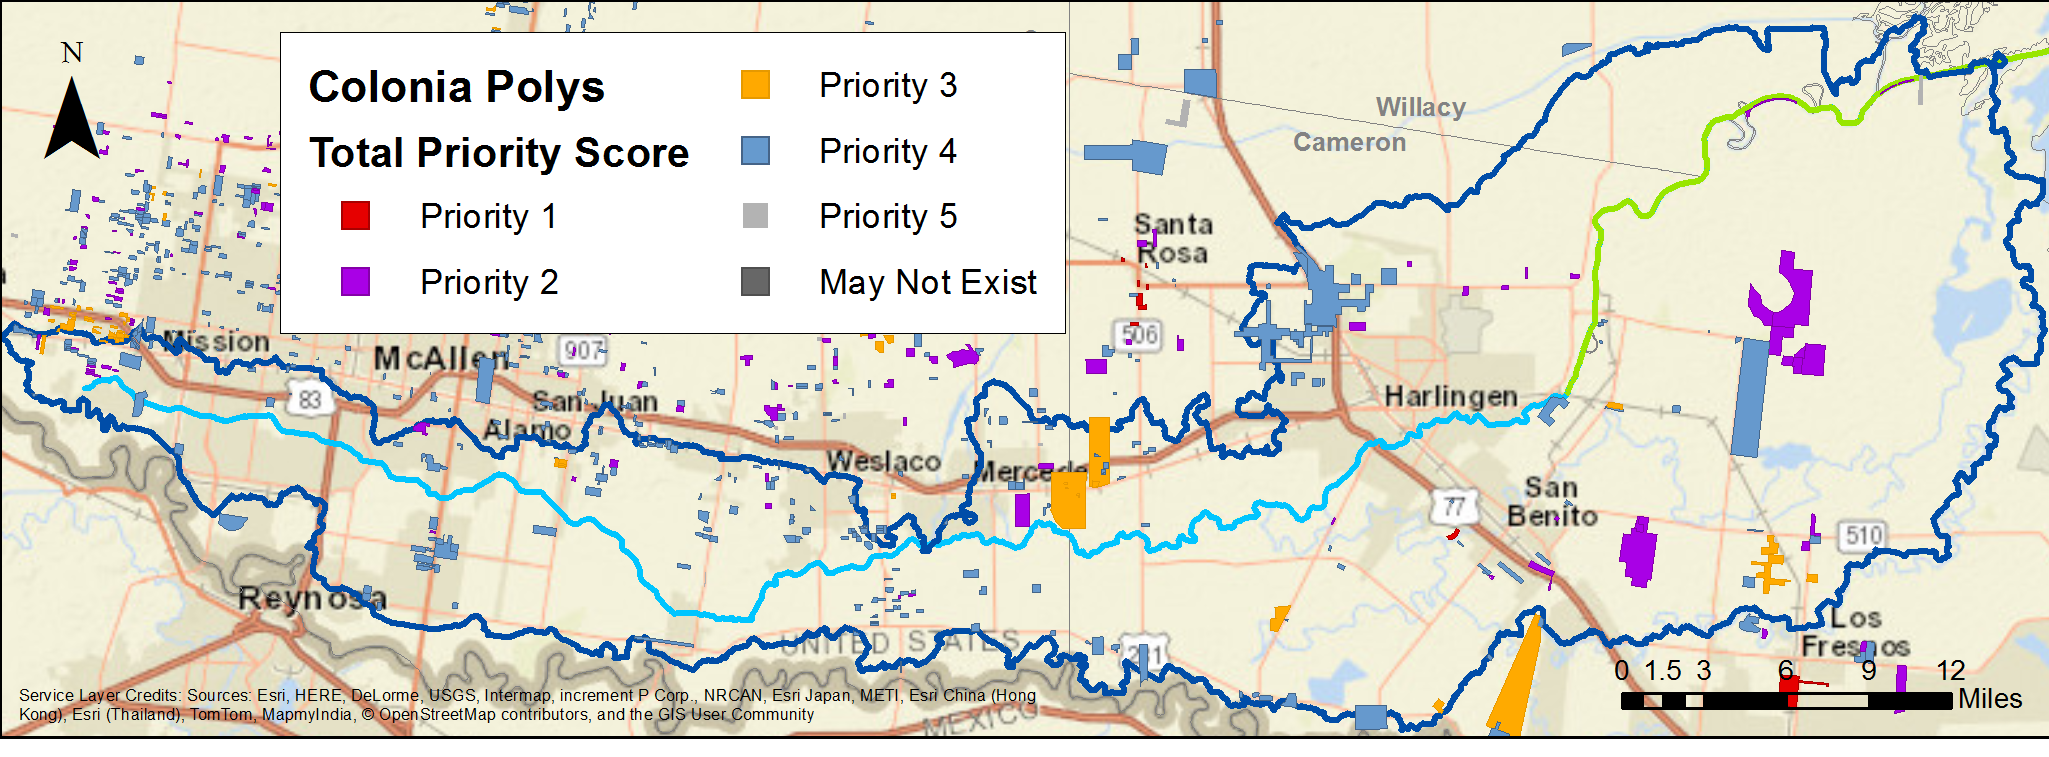
Pollution Sources
Known OSSF Locations in the Arroyo Colorado Watershed – December 2024

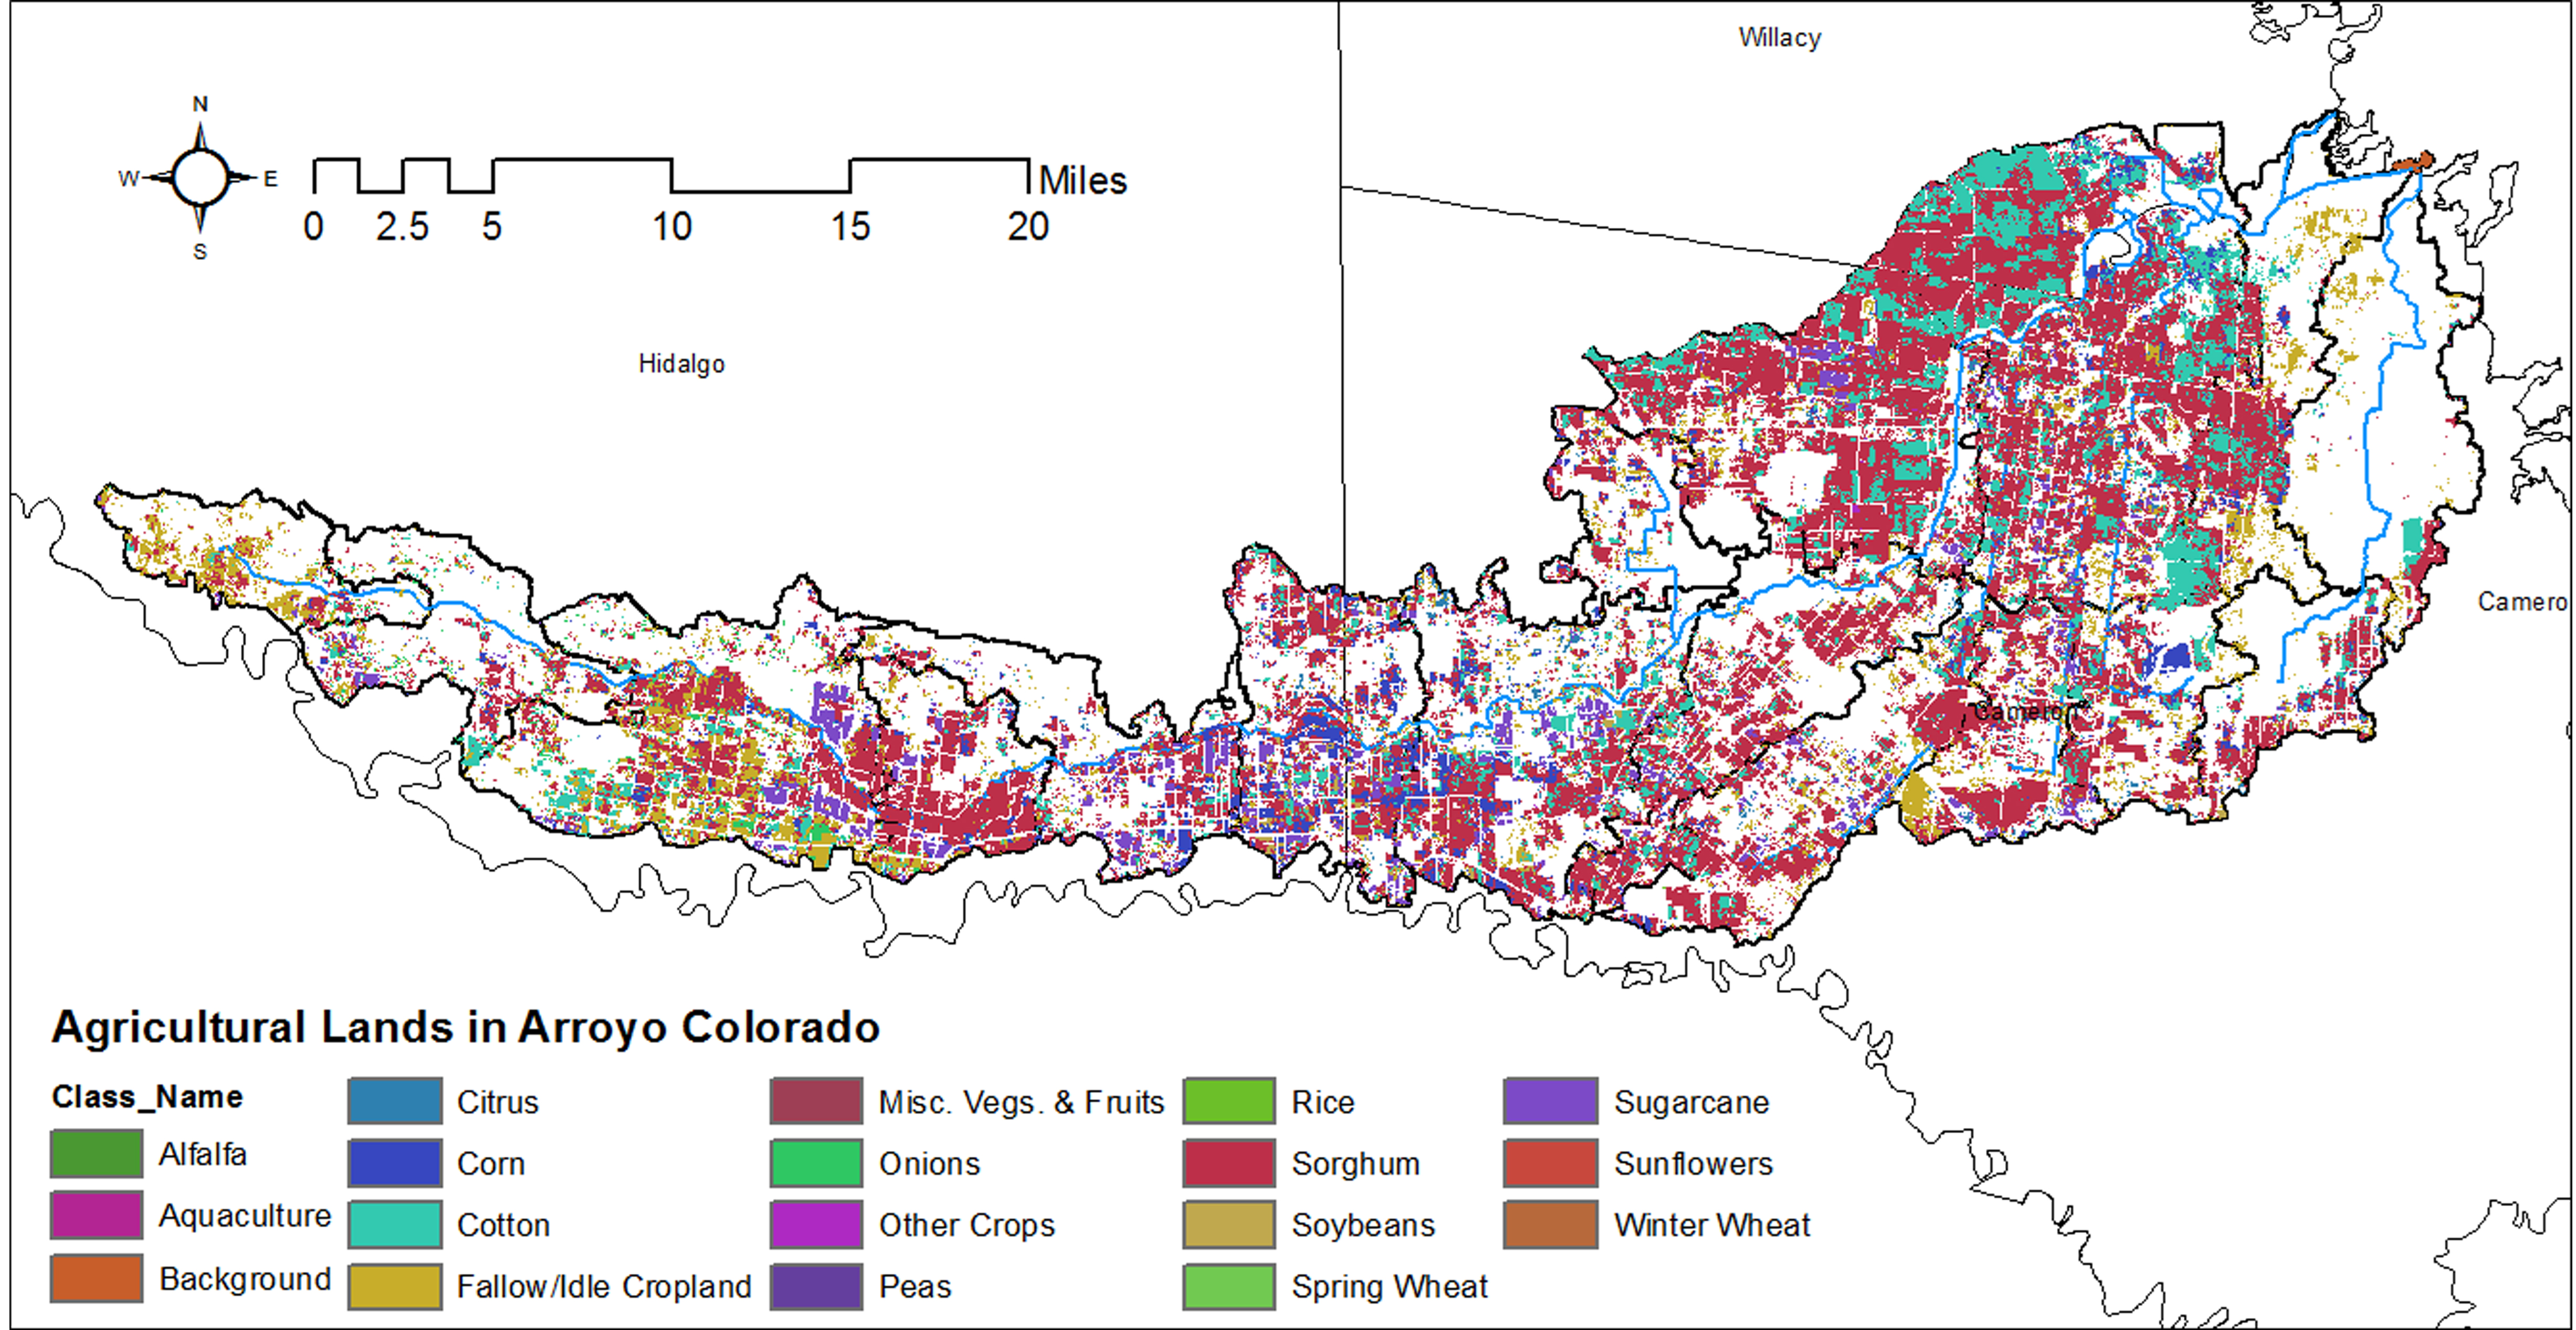
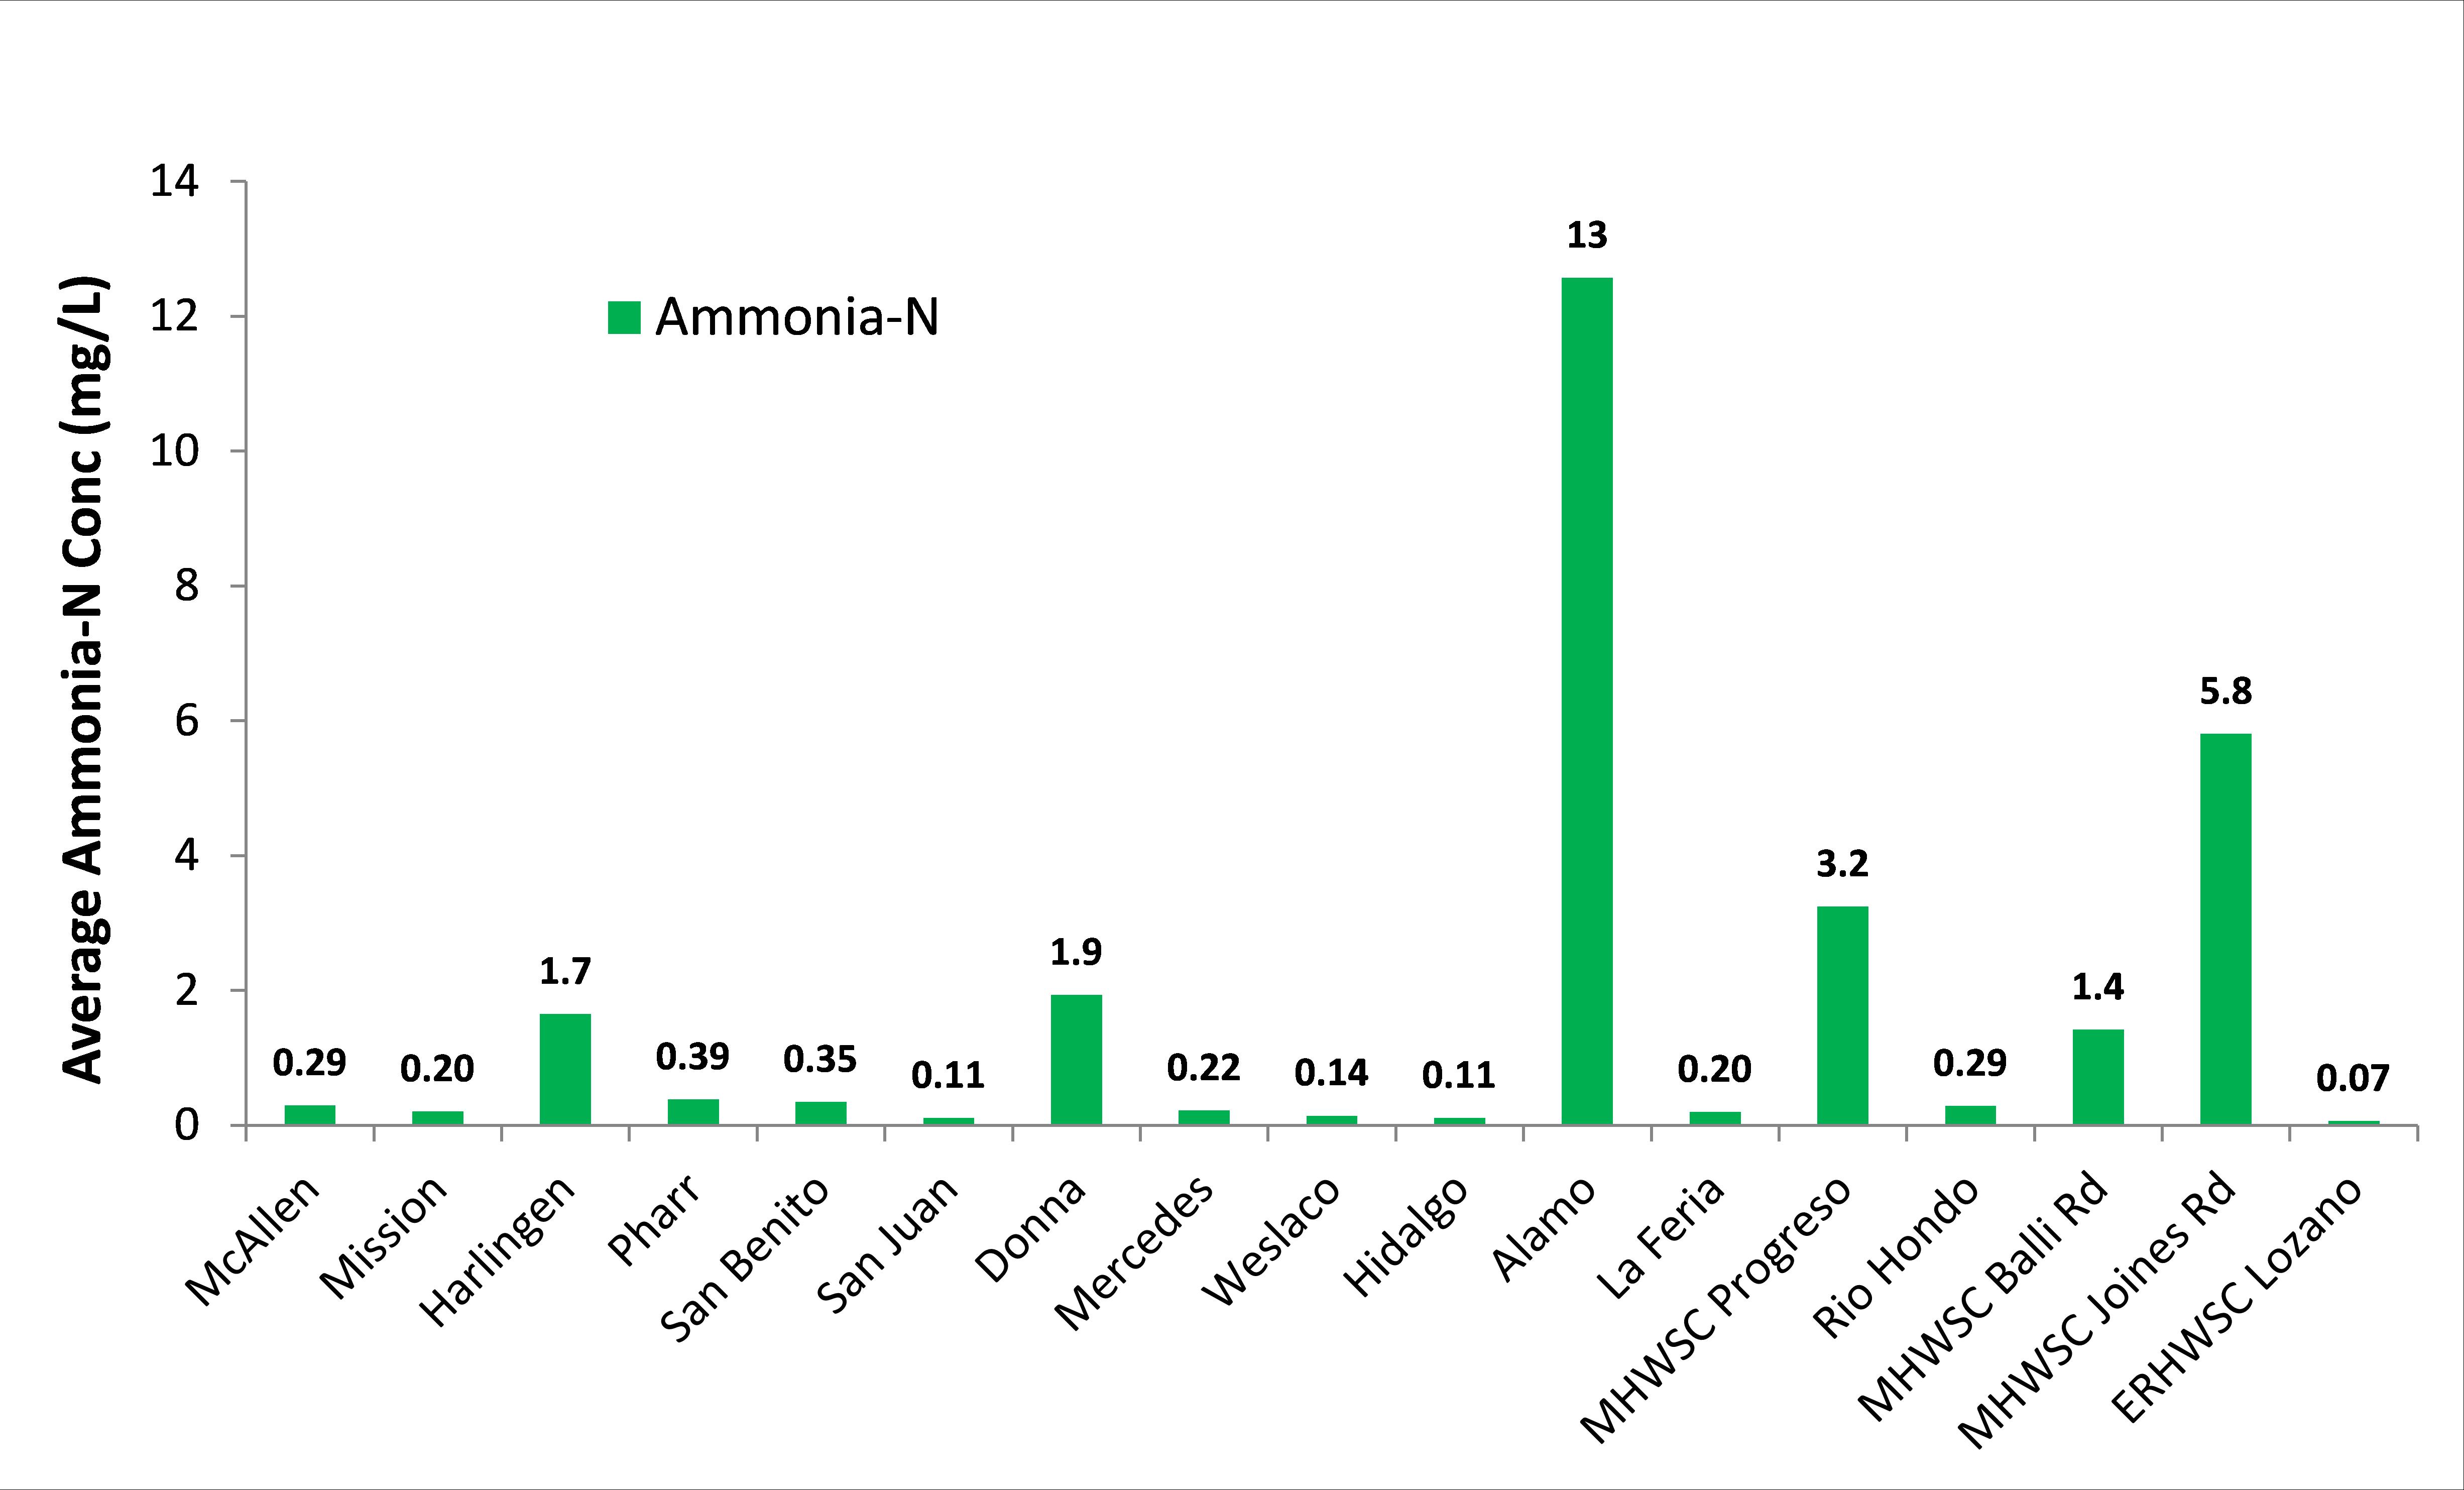
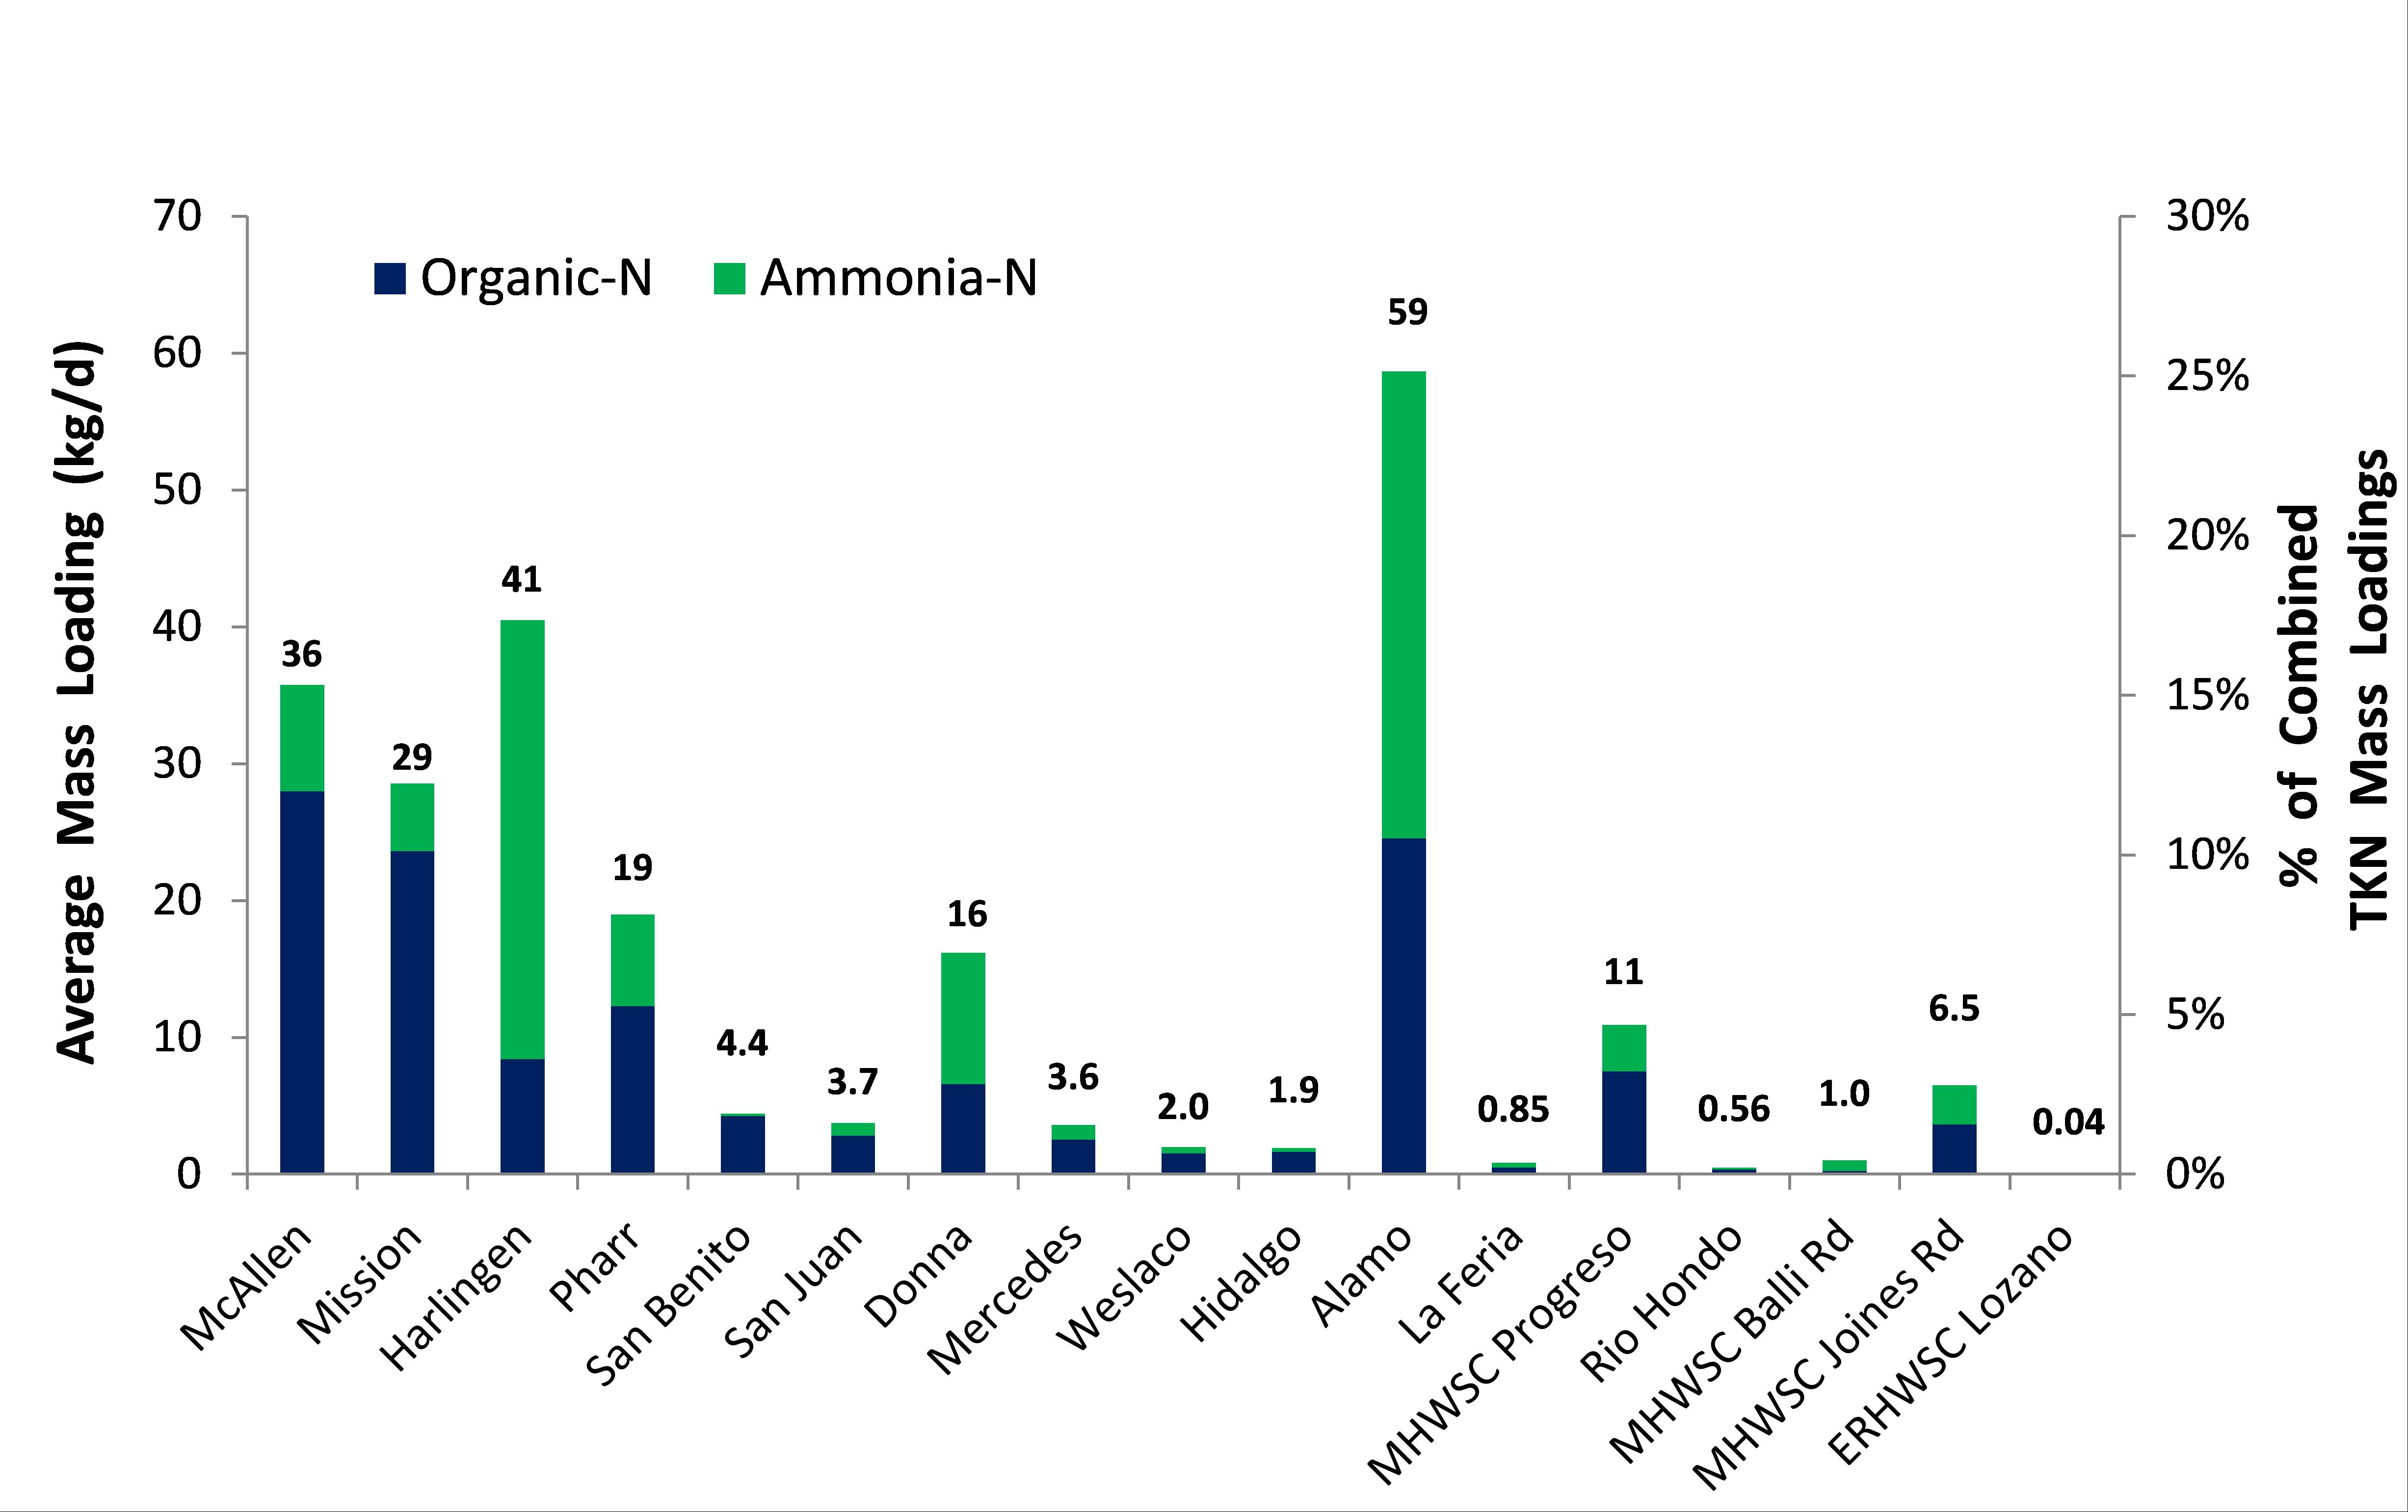
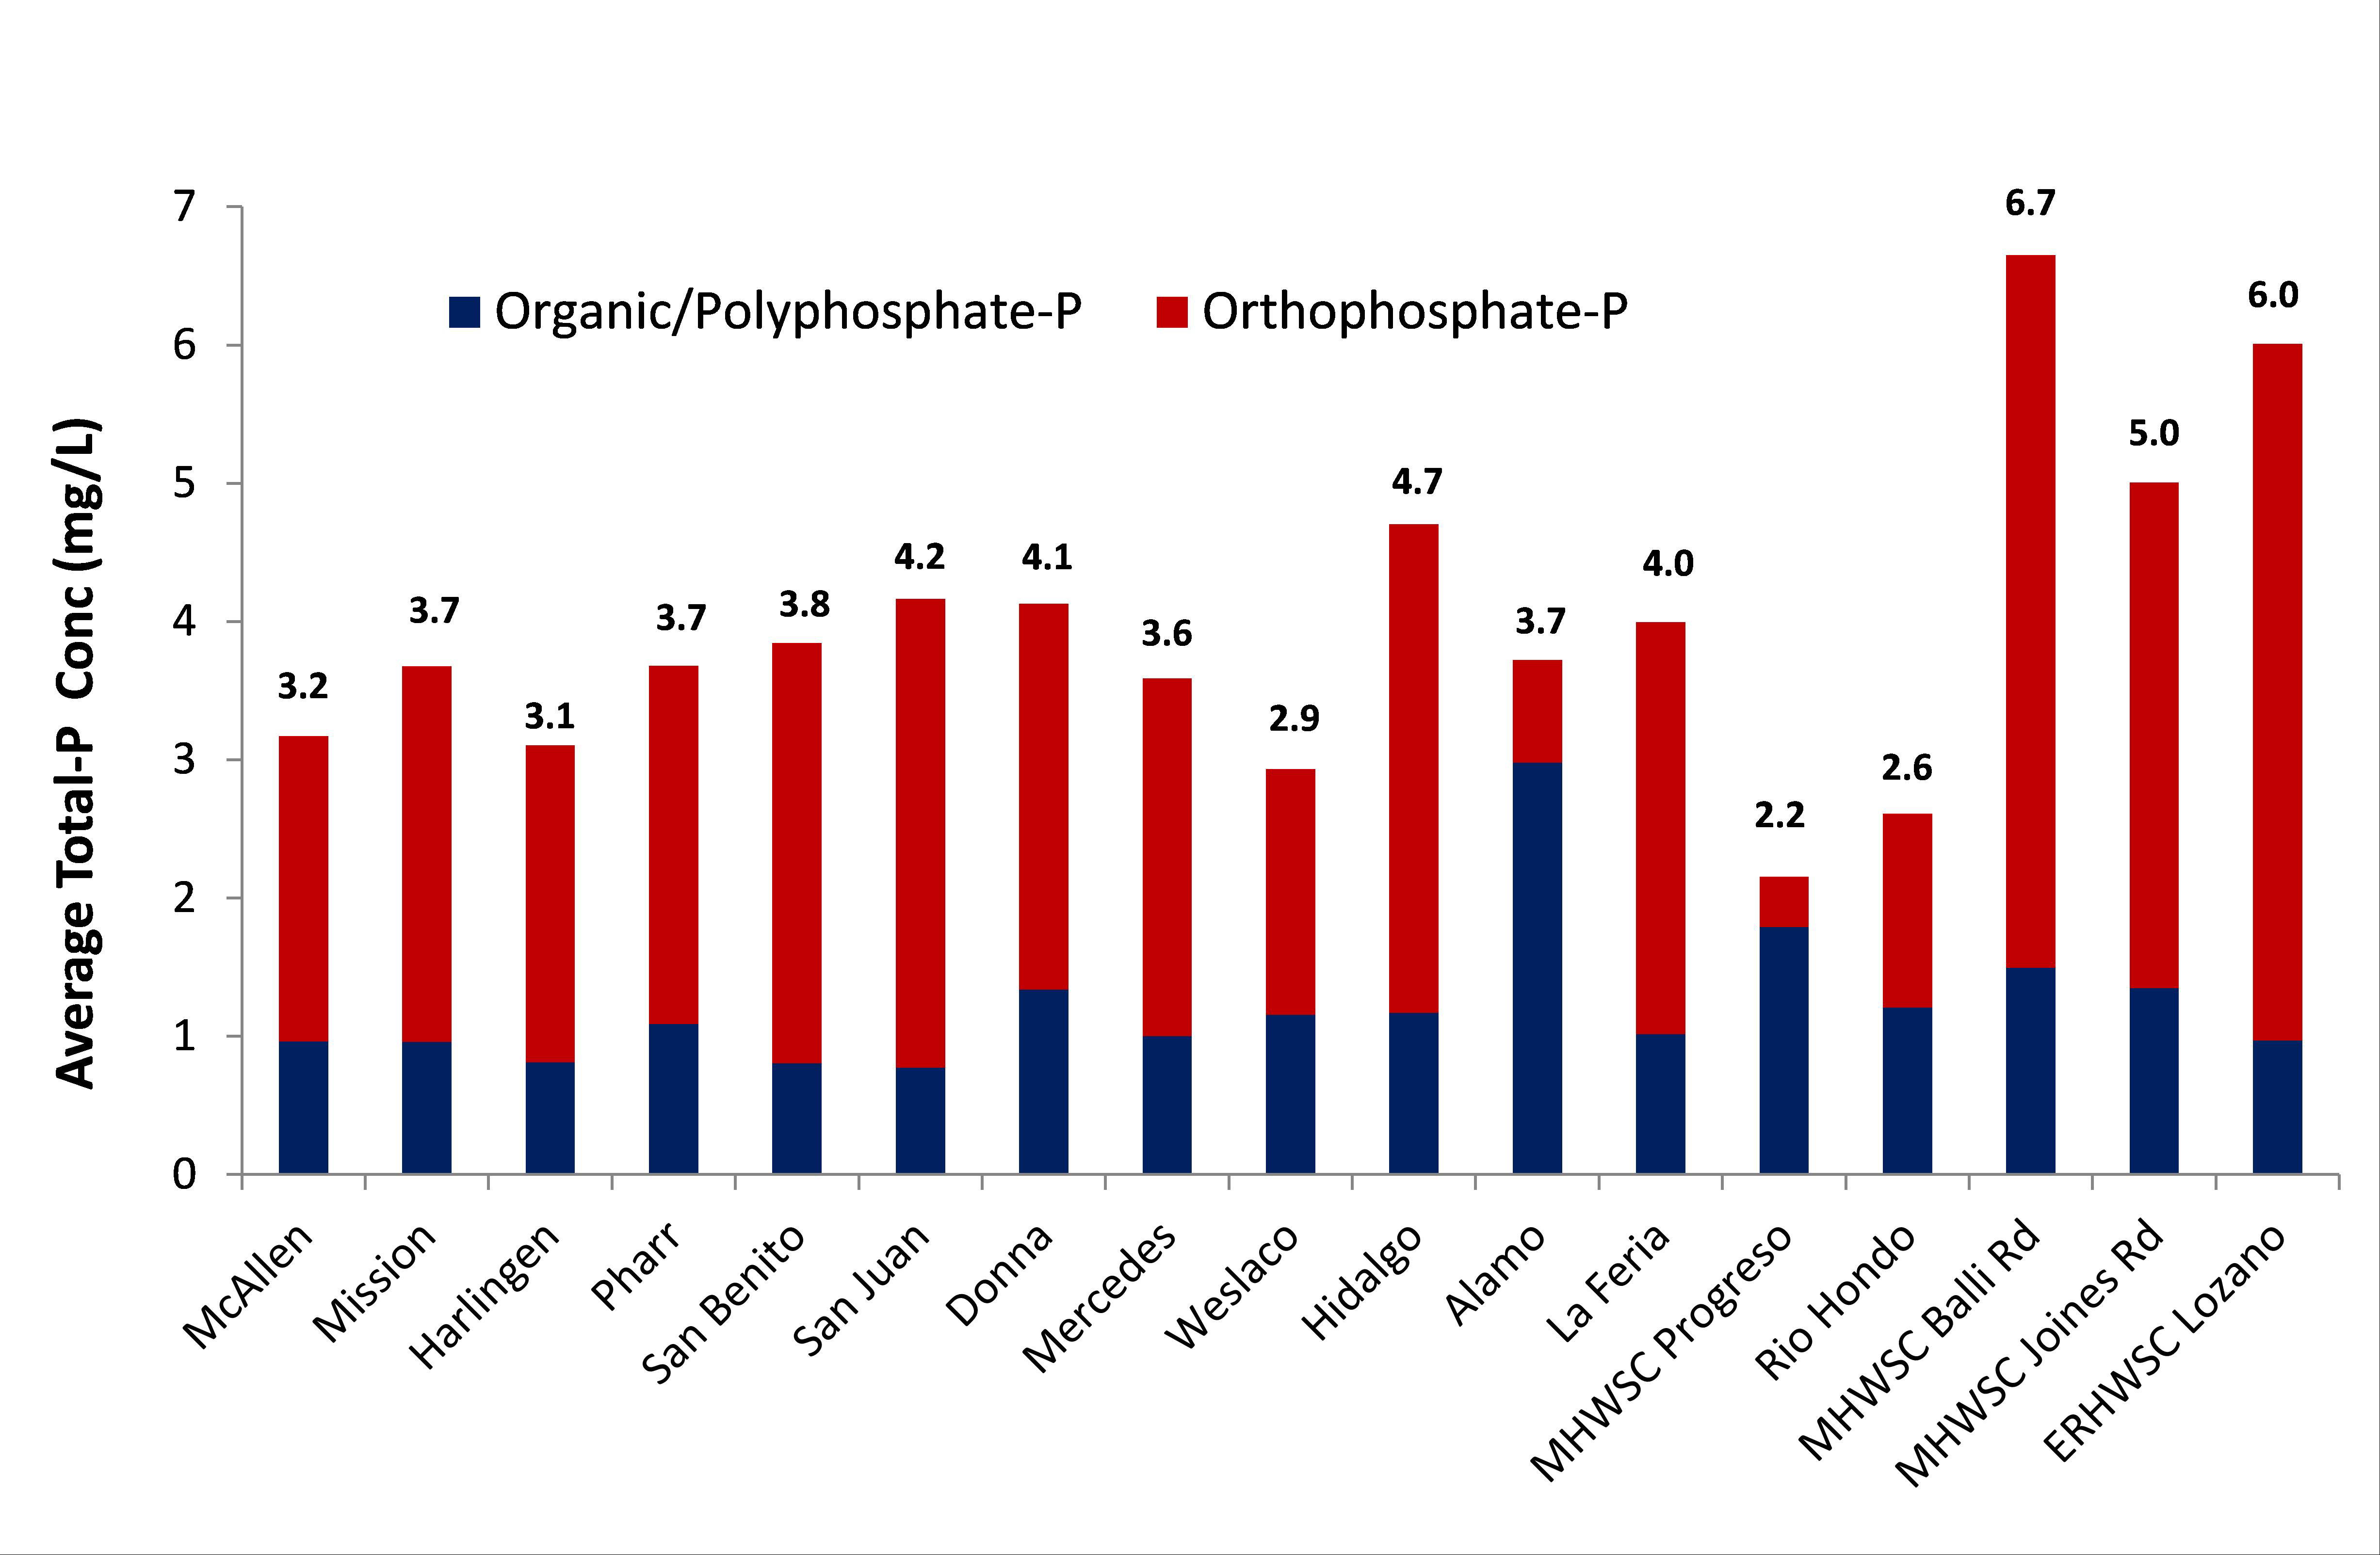
Figures
(from the 2017 Update to the Watershed Protection Plan)
Click to view larger image

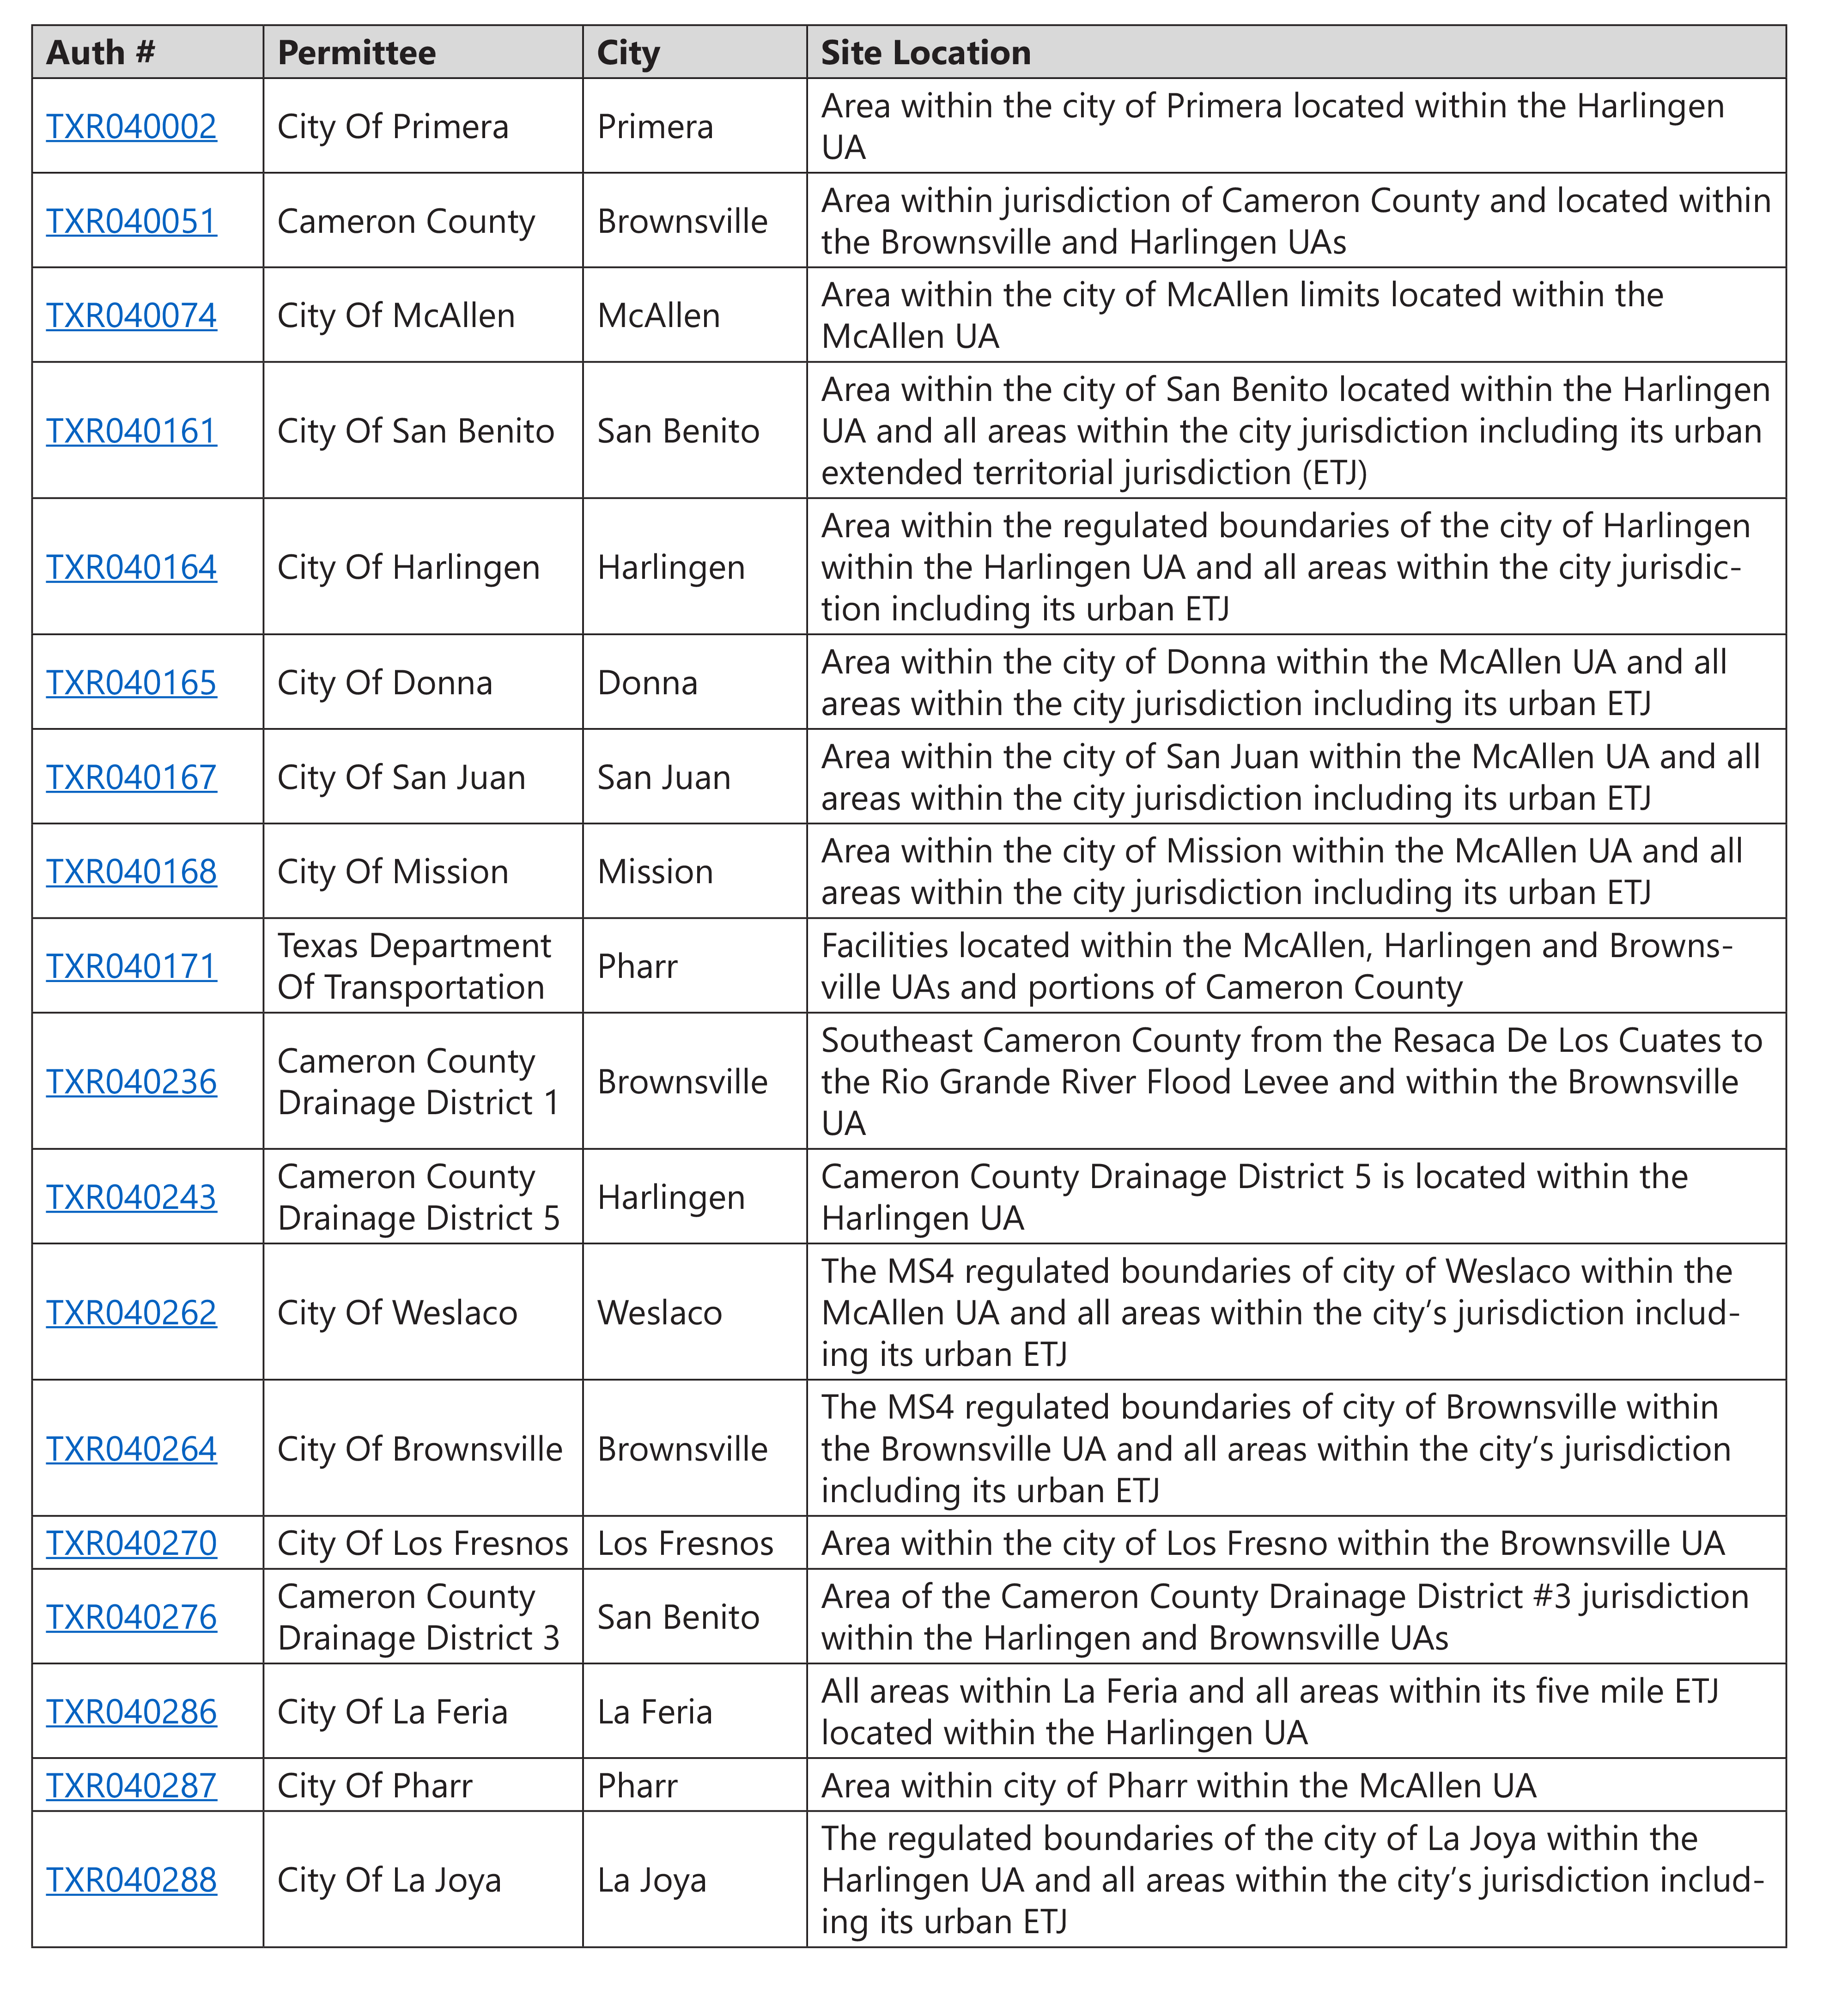
Tables
(from the 2017 Update to the Watershed Protection Plan)