Water Quality Assessment

Figures

(from the 2017 Update to the Watershed Protection Plan)

Click to view larger image
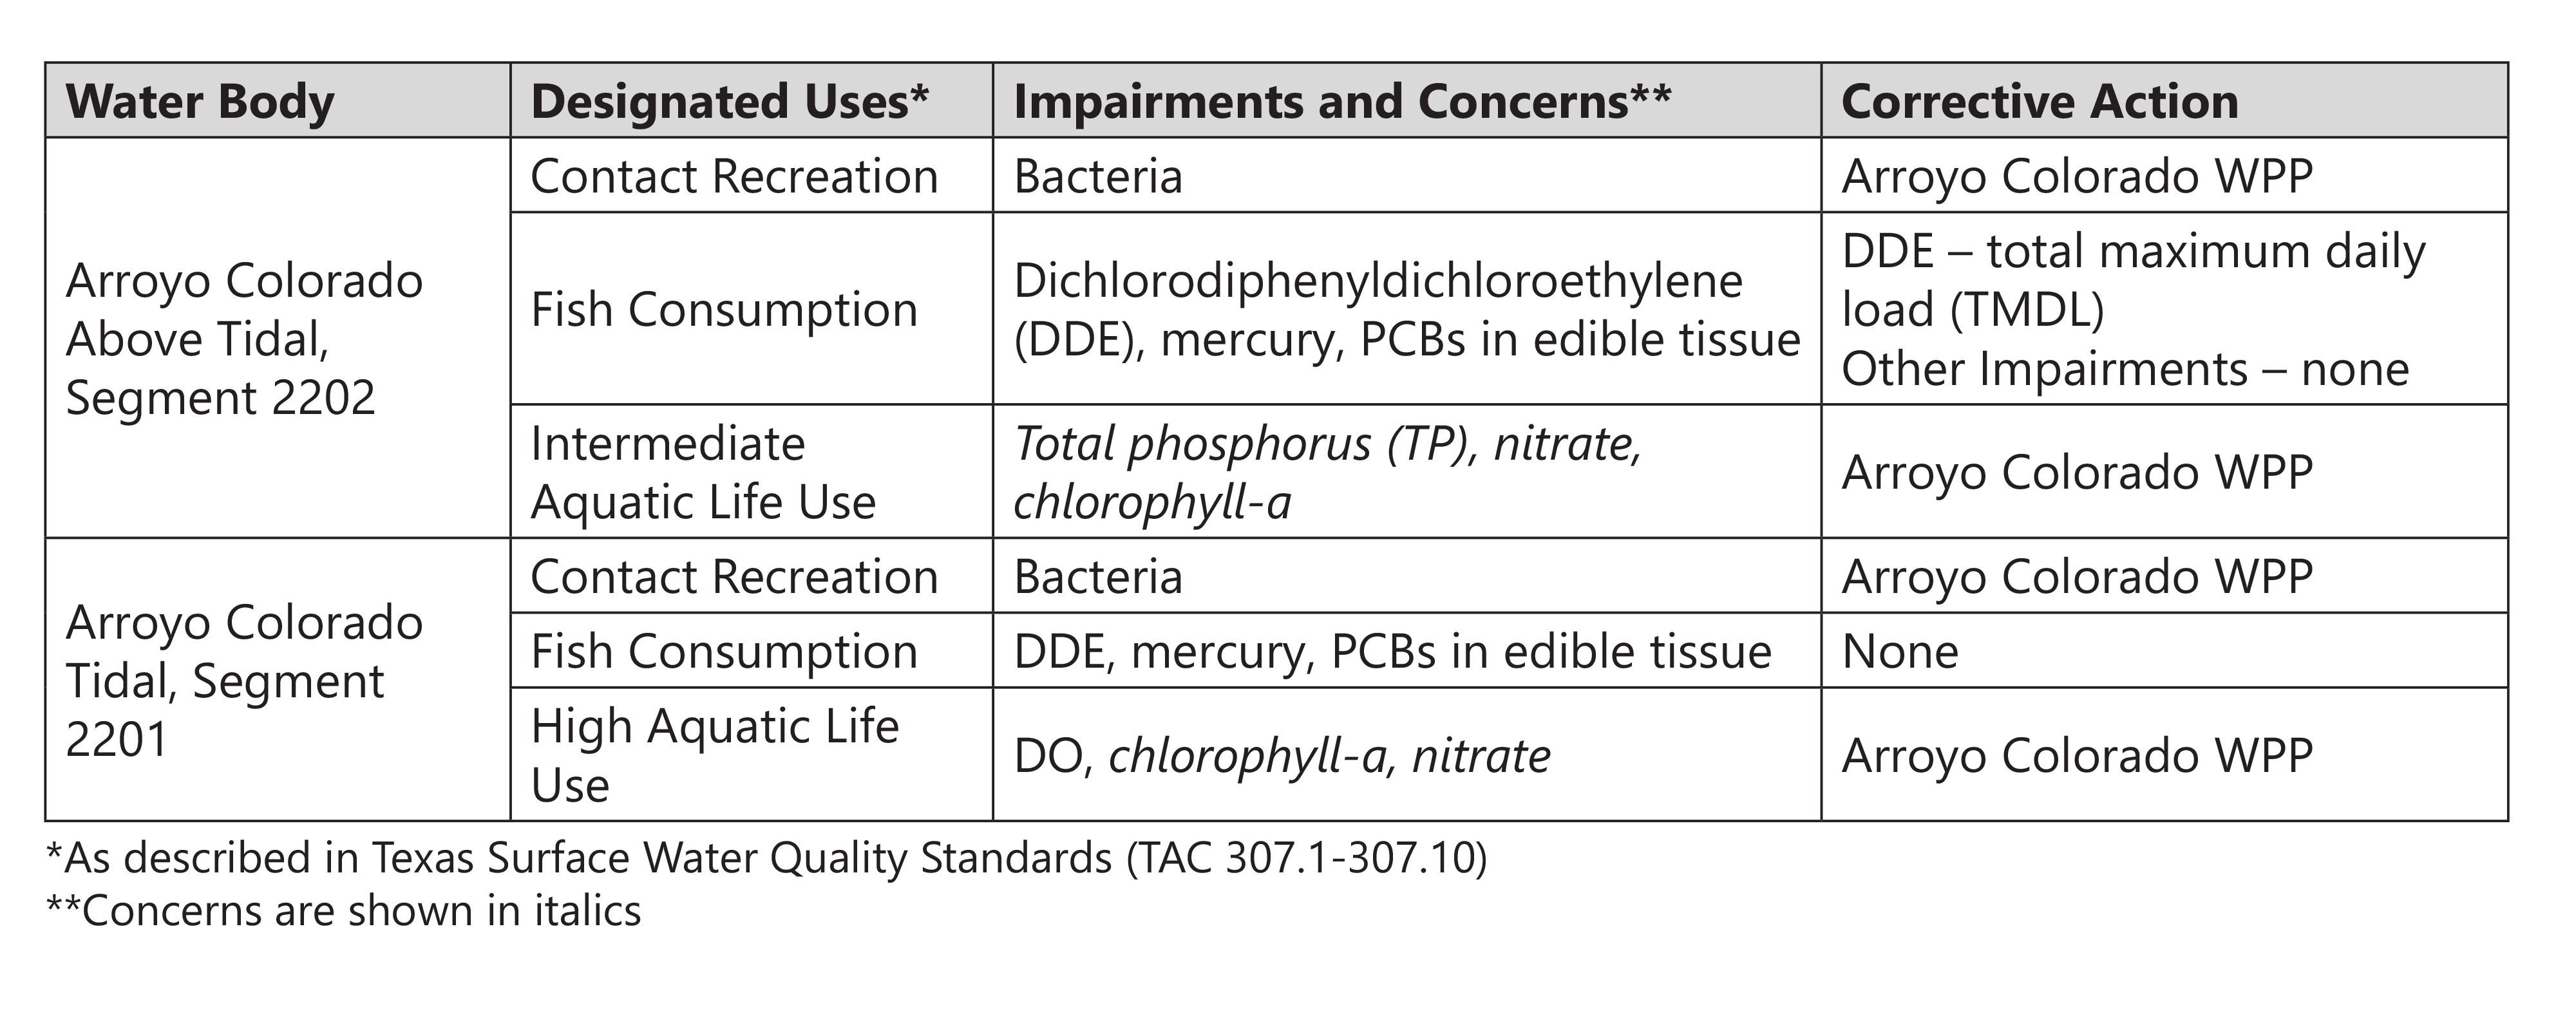
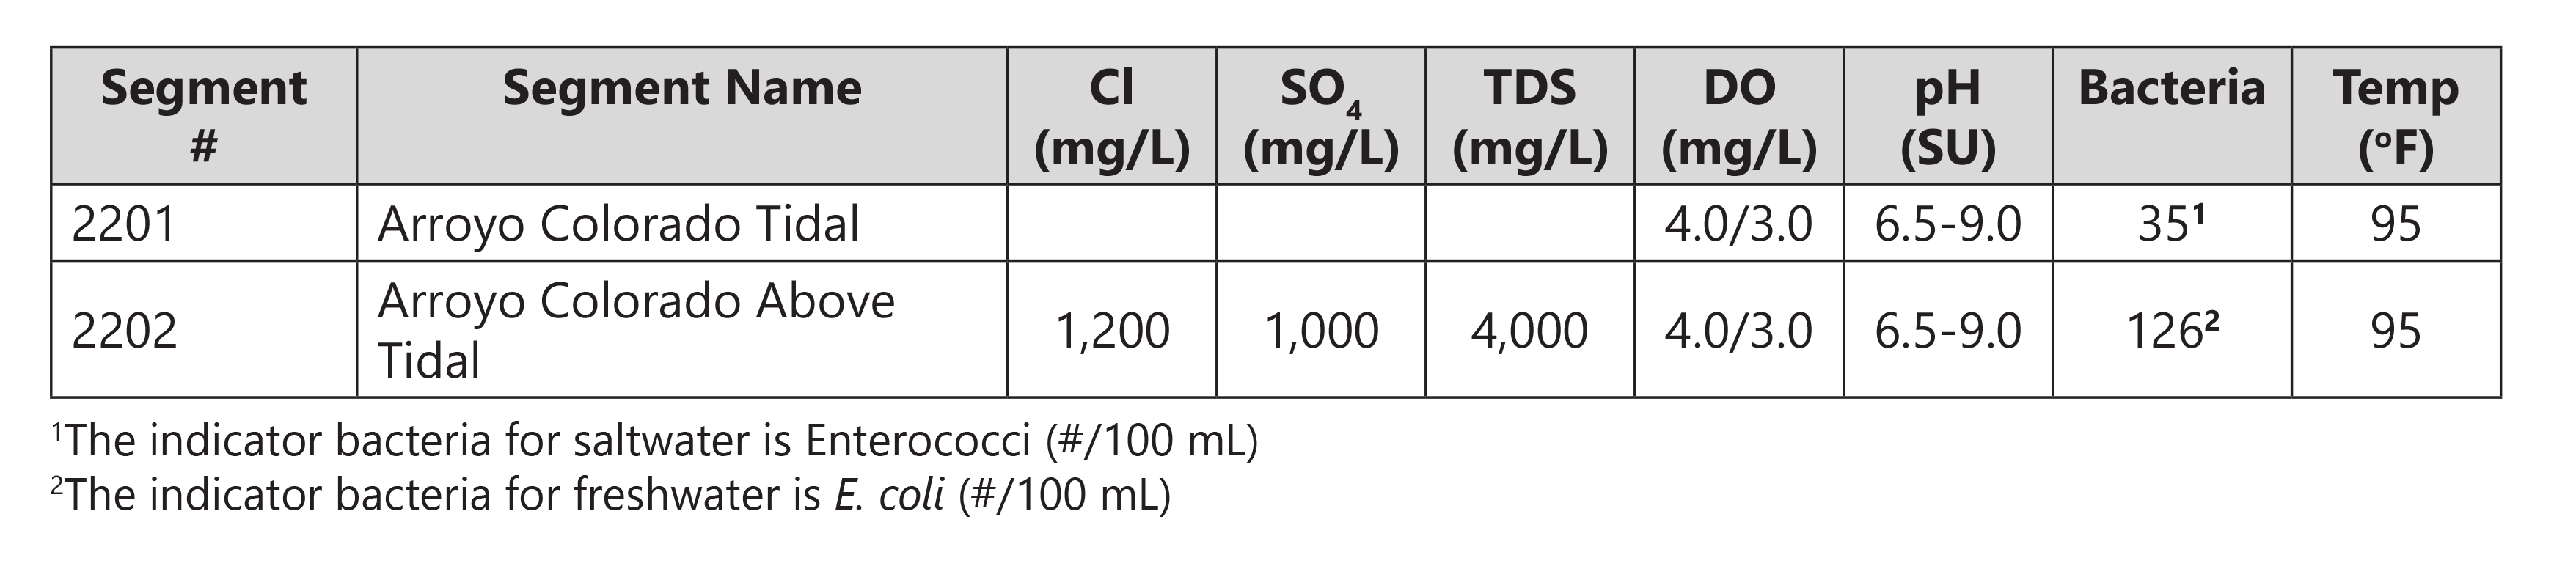
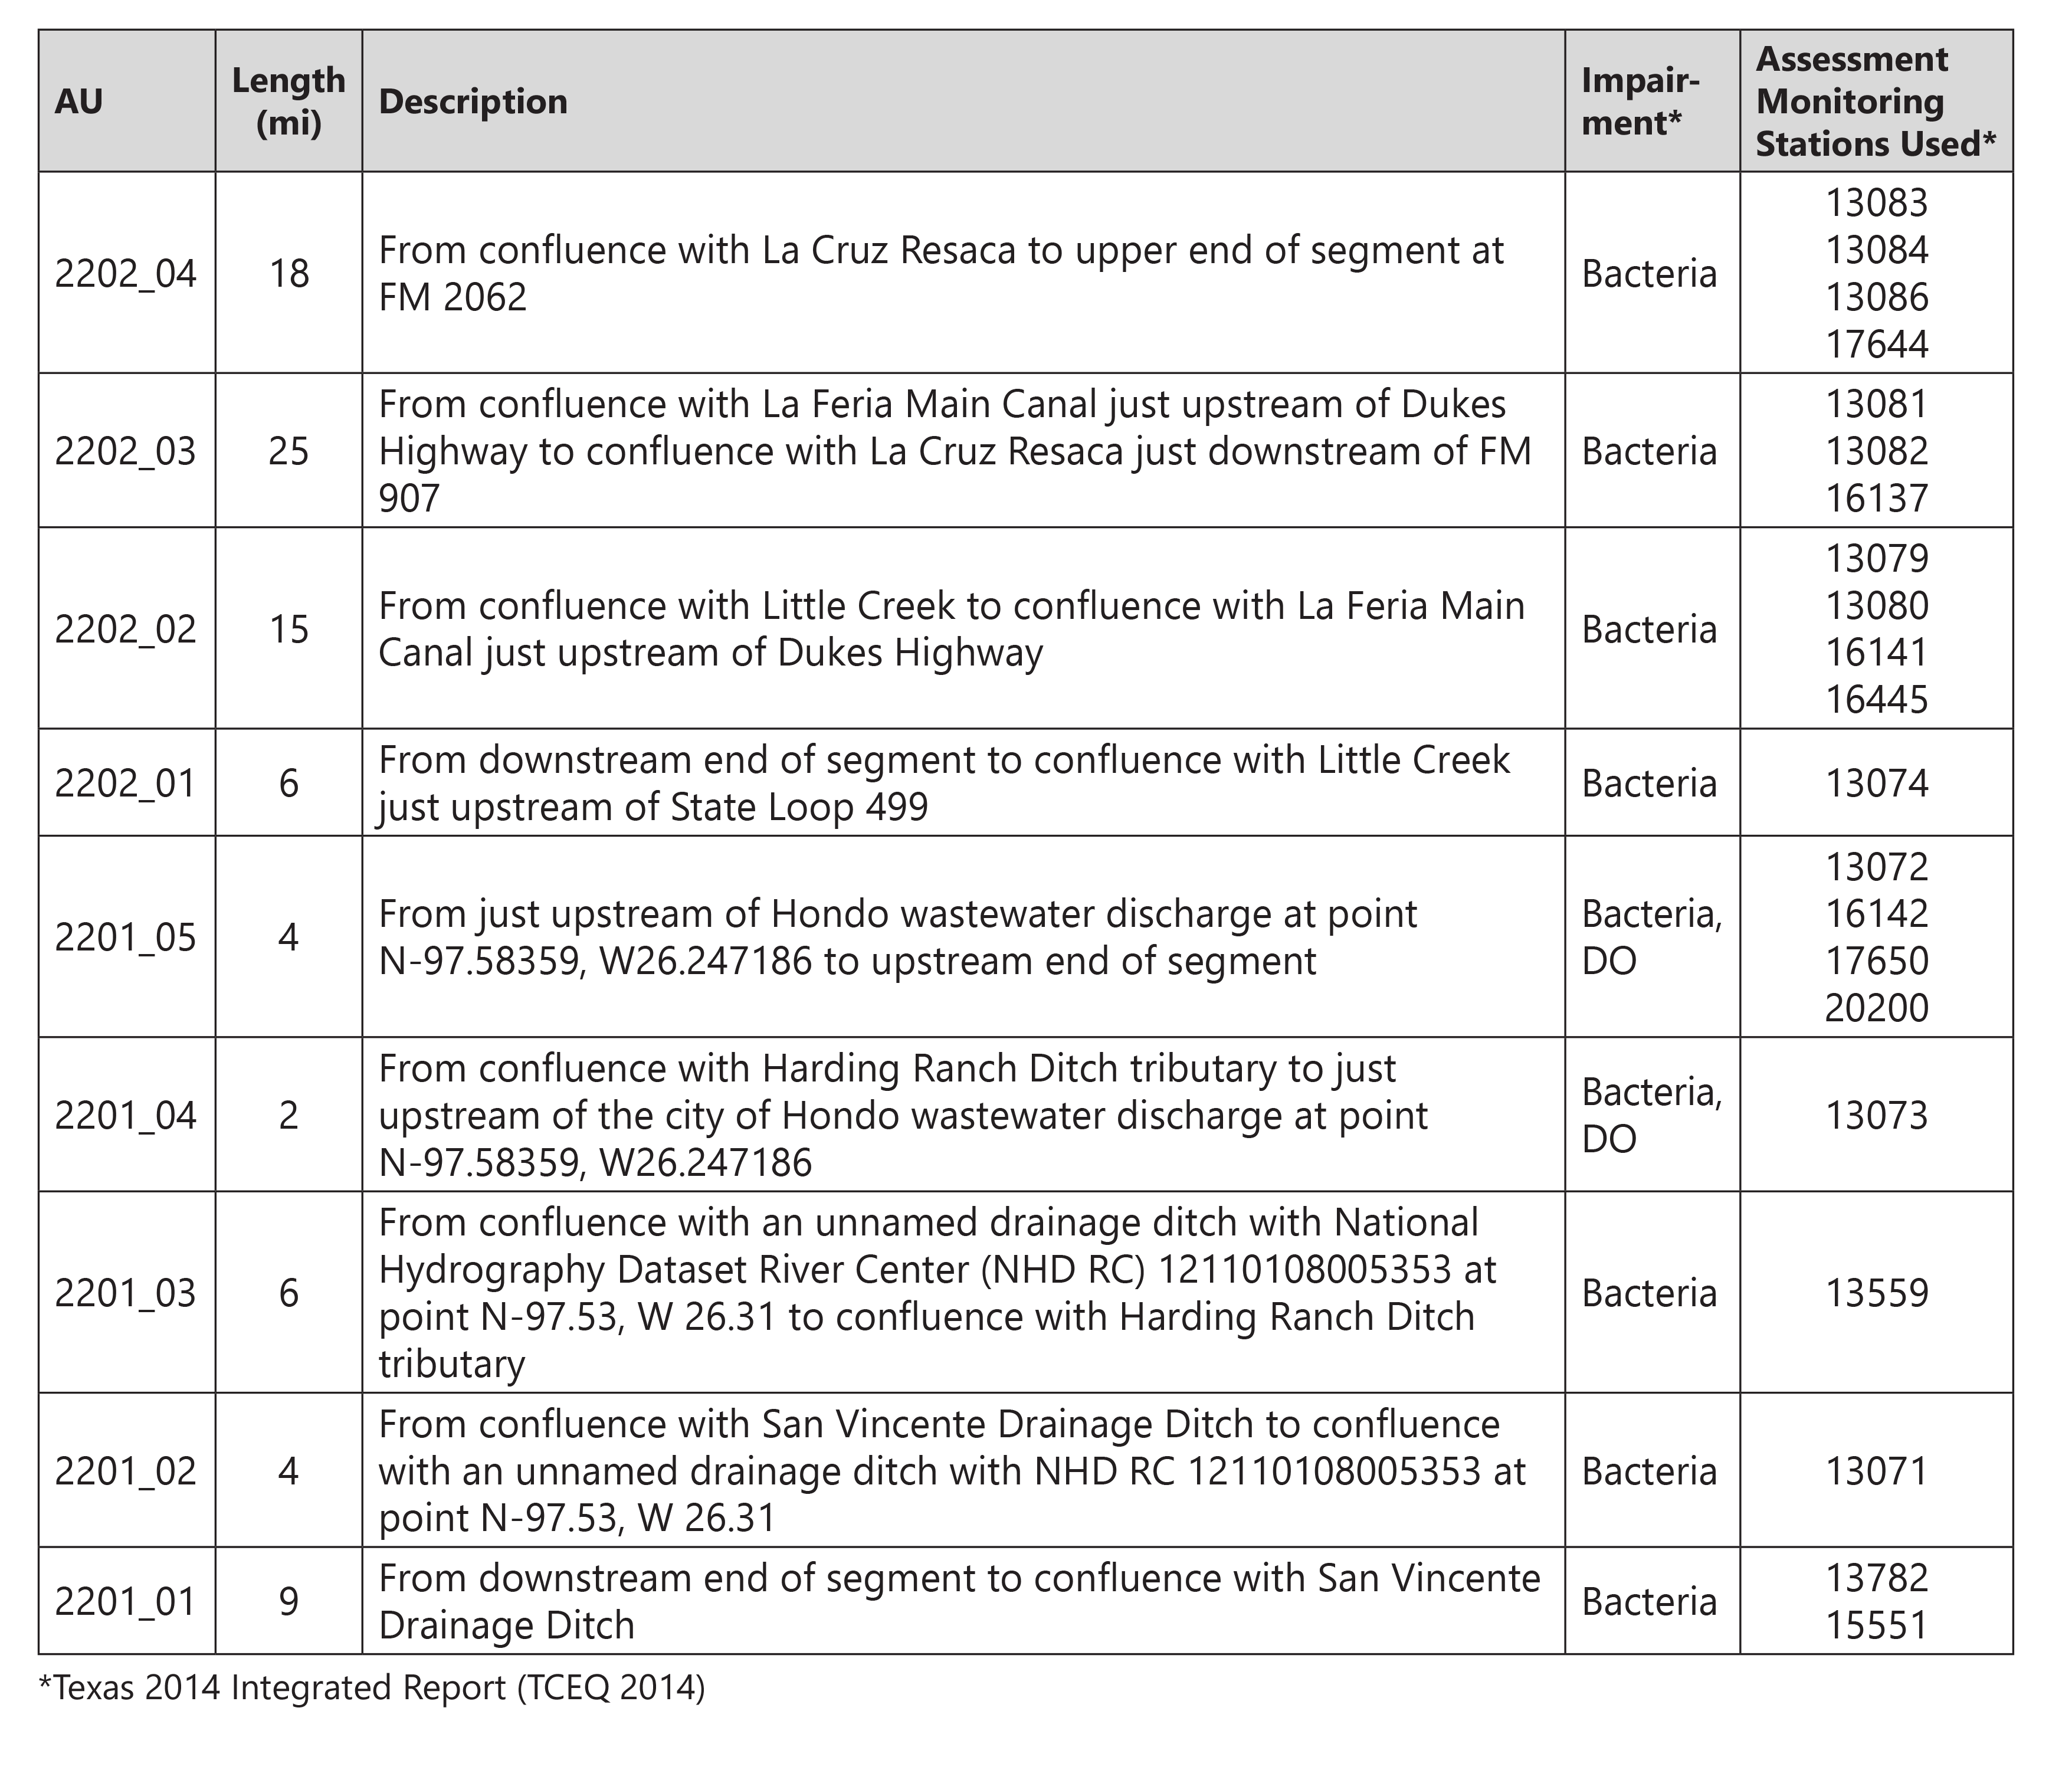
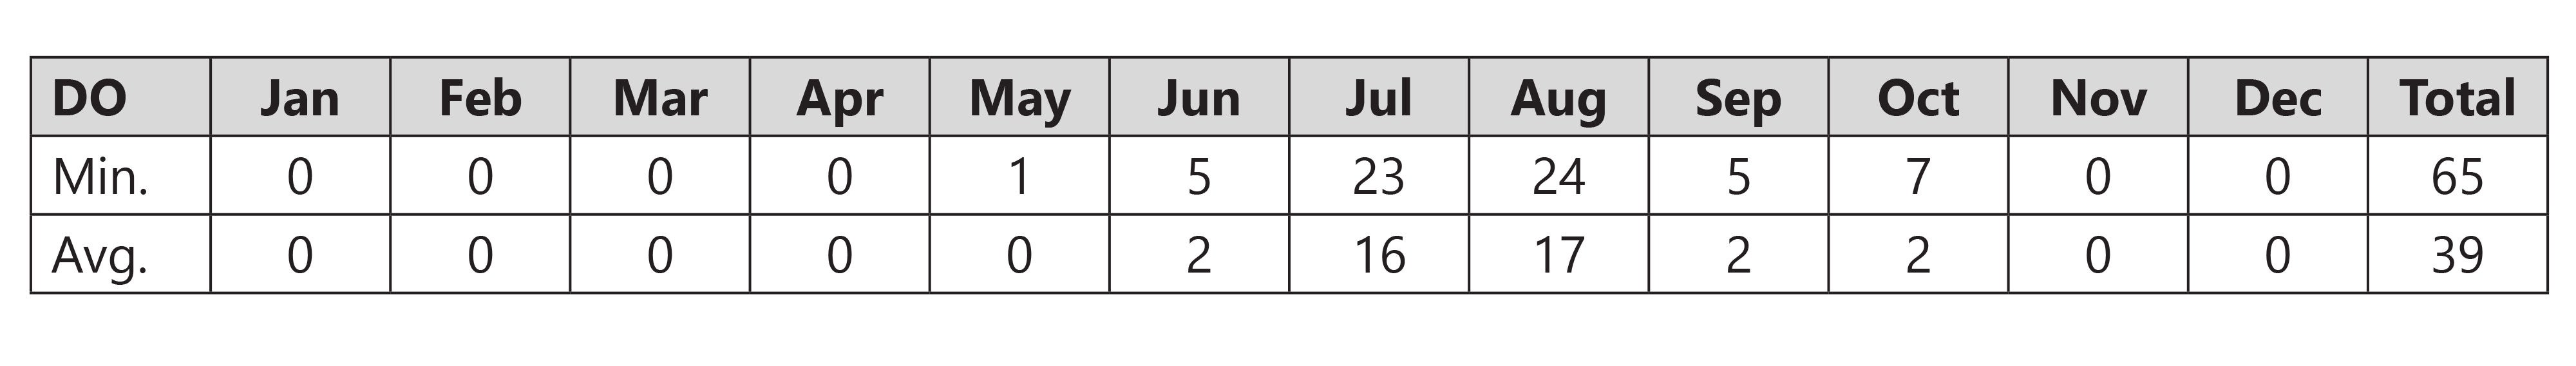
Figure 4.1. Arroyo Colorado Assesssment Units
Figure 4.2. 24-hour data collected within the DO Zone of Impairment
Figure 4.3. Time series of daily minimum DO and daily average DO at the USGS station on Arroyo Colorado Tidal at FM 106, Rio Hondo, TX for the period of March 1, 2015 – February 29, 2016
Figure 4.4. DO time series data for Segments 2202 and 2201
Figure 4.5. Nitrate + Nitrite-nitrogen concentrations in the Arroyo Colorado
Figure 4.6. Ammonia-N concentrations at sites 13073 and 13074
Figure 4.8. Chlorophyll-a concentrations in the Arroyo Colorado
Figure 4.9. Total suspended solids concentrations in the Arroyo Colorado
Figure 4.10. E. coli and Enterococcus concentrations in the Arroyo Colorado

Tables

(from the 2017 Update to the Watershed Protection Plan)
Table 4.1. Designated uses, impairments and concerns for the Arroyo Colorado
Table 4.2. Water quality standards for designated uses of the Arroyo Colorado
Table 4.3. Arroyo Colorado AUs (upstream to downstream)
Table 4.4. Number of days with DO below the 24-hour minimum and average criteria at the USGS station on Arroyo Colorado Tidal at FM 106, Rio Hondo, TX for March 1, 2015 – February 29, 2016